| Median Sale Price | Average Sale Price | Units Sold | Newly Listed | Days on Market | |
|---|---|---|---|---|---|
| Single-Family | $290,000 (5.1%) | $323,786 (10.3%) | 353 (1.2%) | 599 (2%) | 91 (-22.2%) |
| Condos | $230,000 (12.2%) | $256,677 (6.2%) | 113 (-6.6%) | 151 (-16.6%) | 77 (-6.1%) |
| Multi-Family | $315,000 (1.6%) | $377,274 (-19.4%) | 23 (-41%) | 57 (72.7%) | 59 (-50.4%) |
| Land | $120,000 (42.5%) | $149,432 (-14.4%) | 31 (-26.2%) | 103 (4%) | 288 (9.5%) |
Historically, the first 3 months of the year represent the slowest period for sales. With a smaller number of sales, data within this report can be affected in a positive or negative direction without truly representing a trend in the market.
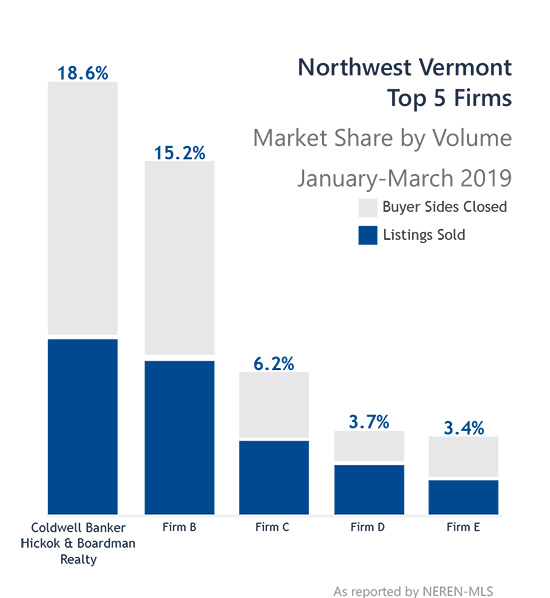
Our skilled Realtors® can provide you with a more in-depth analysis on specific price points in towns and neighborhoods. Given our market leading position, we are prepared to provide unparalleled service to our clients.
 The same market dynamics that we have reported over the past 2-3 years continue to play out in northwest Vermont. Shrinking inventory of homes for sale and pent up buyer demand have resulted in an increase in median and average sale prices across most market segments. Mortgage interest rates have declined recently after an uptick during 2018, keeping buyers in the market and willing to pay more for updated homes. With limited cash available for renovations, buyers are willing to take on a higher mortgage payment for homes with renovated kitchens, bathrooms, flooring and other amenities. Sellers may want to take advantage of this opportune time to list their home while demand is strong.
