| Median Sale Price | Average Sale Price | Units Sold | Newly Listed | Days on Market | |
|---|---|---|---|---|---|
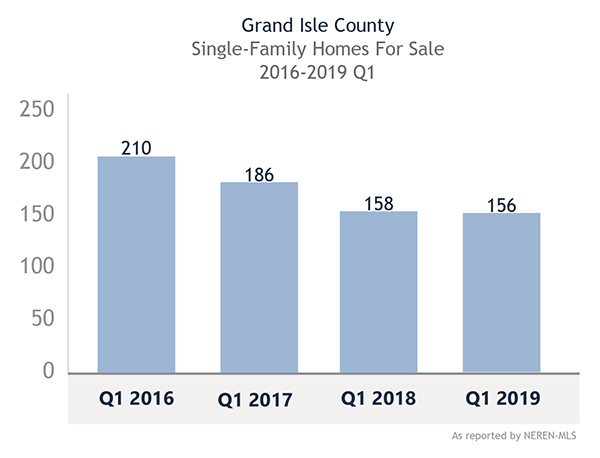
| Single-Family | $255,000 (55%) | $272,443 (12.1%) | 21 (31.3%) | 34 (3%) | 158 (-42.6%) |
| Condos | N/A | N/A | N/A | 1 (N/A) | N/A |
| Multi-Family* | N/A | N/A | N/A | 1 (N/A) | N/A |
| Land | $413,500 (548%) | $413,500 (548.63%) | 2 (0%) | 7 (75%) | 574 (102.1%) |
The 1st quarter shows a healthy increase in the number of homes sold in 2019 versus the same period last year, however this is compared to a sharp decline during the 1st quarter of 2018.
 The Average Days of Market (DOM) from listing to closing has dropped to 158 days – or just over 5 months. While this is the longest days on market out of the 4 counties in the report, desirable and well-priced homes are selling in considerably less time than average.
Historically, the strength of the market in Grand Isle County is during the spring and summer months. A preponderance of second homes has a clear impact on the sales cycles. Activity in the next 2 – 3 months will dictate what the 2019 market has in store for the county.
