| Single Family | ||||
|---|---|---|---|---|
| Median Sale Price: | Average Sale Price: | Units Sold: | Newly Listed: | Days on Market: |
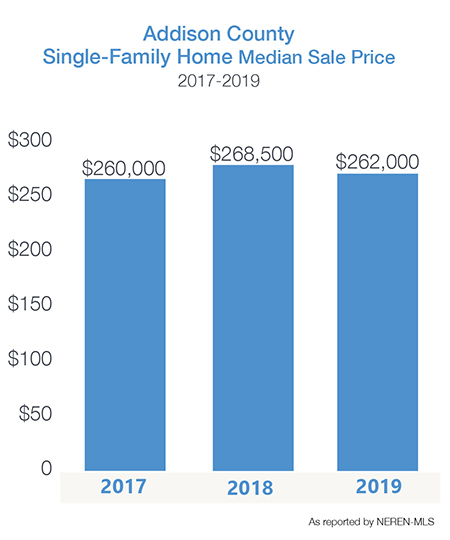
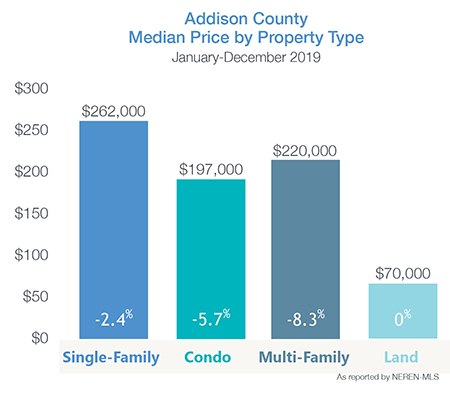
| $262,000 -2.4% | $299,352 +0.9% | 383 +10.1% | 506 -1.0% | 115 +1.8% |
| Condos | ||||
|---|---|---|---|---|
| Median Sale Price: | Average Sale Price: | Units Sold: | Newly Listed: | Days on Market: |
| $197,000 -5.7% | $229,759 +2.8% | 27 +58.8% | 28 +16.7% | 48 -22.6% |
The number of single-family homes sold in 2019 jumped 10% in Addison County, while newly listed properties and sales prices remained stable. Condominium sales rose from 17 units in 2018 to 27 units in 2019. An increase in condos available fueled this growth along with more affordable price points and ease of maintenance.
 Buyers are attracted to the relative affordability compared to neighboring Chittenden County – along with the quaint Vermont feel of restaurants, galleries and small shops that make up the downtowns of many of the towns in Addison County.
Topping the list of closed sales in the county were Middlebury, Bristol, Ferrisburgh, and Vergennes.
 A 25% increase in homes available for purchase in Vergennes resulted in a 23% rise in single family homes sold through the year. Undoubtedly, Vergennes’ thriving downtown and proximity to Lake Champlain appeal to many buyers including Millennials searching for a work-play lifestyle.
Cornwall, Panton and Weybridge lead the county with the highest median sales price.
| Single-Family | MEDIAN SALE PRICE | VS 2018 | UNITS SOLD | VS 2018 | NEWLY LISTED | VS 2018 | DAYS ON MARKET |
|---|---|---|---|---|---|---|---|
| Addison County | $262,000 | -2.40% | 383 | 10.10% | 506 | -1.00% | 115 |
| Addison | $261,000 | -17.70% | 22 | 8333.00% | 28 | -6.70% | 213 |
| Bridport | $257,000 | -10.80% | 15 | 66.70% | 15 | -11.80% | 167 |
| Bristol | $260,000 | 8.50% | 31 | 10.70% | 40 | 17.70% | 87 |
| Cornwall | $428,500 | 7.50% | 14 | 40.00% | 12 | -50.00% | 217 |
| Ferrisburgh | $277,300 | -10.10% | 41 | 57.70% | 49 | 14.00% | 98 |
| Goshen | $133,868 | 0.00% | 4 | 0.00% | 7 | 16.70% | 146 |
| Granville | $340,000 | -20.00% | 5 | 66.70% | 5 | -28.60% | 175 |
| Hancock | $182,900 | 94.60% | 2 | -60.00% | 7 | 16.70% | 105 |
| Leicester | $192,000 | 9.10% | 15 | 150.00% | 29 | 163.60% | 88 |
| Lincoln | $204,000 | -18.70% | 17 | -5.60% | 23 | -20.70% | 149 |
| Middlebury | $285,500 | 2.90% | 72 | 4.40% | 89 | 12.70% | 70 |
| Monkton | $294,000 | -7.60% | 17 | -29.20% | 30 | -6.30% | 66 |
| New Haven | $301,750 | -9.40% | 10 | -33.30% | 14 | -33.30% | 144 |
| Orwell | $205,000 | -8.90% | 17 | 41.70% | 19 | -5.00% | 160 |
| Panton | $460,500 | 11.60% | 12 | 20.00% | 14 | -26.30% | 173 |
| Ripton | $197,500 | -7.60% | 6 | -25.00% | 7 | -46.20% | 161 |
| Salisbury | $365,000 | 43.10% | 12 | -20.00% | 21 | 0.00% | 163 |
| Shoreham | $207,450 | -24.60% | 16 | -5.90% | 24 | -14.30% | 146 |
| Starksboro | $247,000 | 3.50% | 12 | -33.30% | 17 | -19.10% | 54 |
| Vergennes | $222,500 | -5.00% | 32 | 23.10% | 40 | 25.00% | 60 |
| Waltham | $340,000 | 21.50% | 5 | 66.70% | 7 | 40.00% | 64 |
| Weybridge | $468,750 | 7.80% | 6 | -14.30% | 8 | 0.00% | 149 |
| Whiting | n/a | n/a | n/a | n/a | 1 | -80.00% | n/a |
