Our mid-year report includes data for the first 6 months of 2020, as well as data for the 2nd quarter of 2020 alone. We cannot analyze the trends in the northwest Vermont real estate market without understanding the effects of COVID-19 which struck Vermont in mid-March.
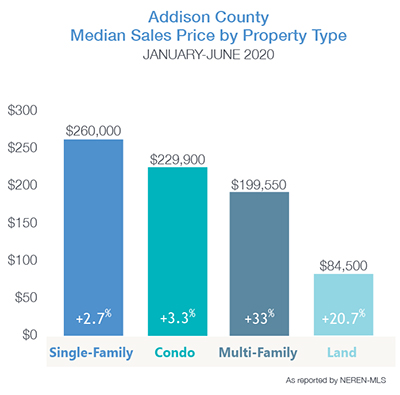
| Single Family January-June | ||||
|---|---|---|---|---|
| Median Sale Price: | Average Sale Price: | Units Sold: | Newly Listed: | Days on Market: |
| $260,000 +2.7% | $273,505 -4.7% | 127 -16.5% | 210 -27.8% | 147 +26.7% |
| Condo January-June | ||||
|---|---|---|---|---|
| Median Sale Price: | Average Sale Price: | Units Sold: | Newly Listed: | Days on Market: |
| $229,900 +3.3% | $231,967 +2.2% | 3 -70% | 7 -56.3% | 25 -60.3% |
| Single Family April-June | ||||
|---|---|---|---|---|
| Median Sale Price: | Average Sale Price: | Units Sold: | Newly Listed: | Days on Market: |
| $275,000 +5.8% | $287,375 -4.8% | 75 -21.1% | 133 -33.5% | 133 +22% |
| Condo April-June | ||||
|---|---|---|---|---|
| Median Sale Price: | Average Sale Price: | Units Sold: | Newly Listed: | Days on Market: |
| $233,000 -5.9% | $233,000 -11.1% | 2 -71.4% | 3 -72.7% | 28 -54.8% |

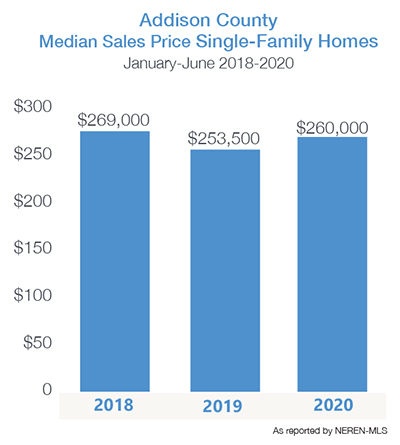
Buyers are attracted to the more rural feel and affordable home prices in Addison County. While the median price of single-family homes jumped to $275,000 during the 2nd quarter, the median price has been fairly stable since 2018. Middlebury, Vergennes, Bristol and Ferrisburgh topped the list for the number of closed sales so far in 2020.
 As travel restrictions for out of state buyers loosen, sales of homes, including lakefront property in Addison County, should recover. Historically, the area accounts for 12-15% of the luxury home sales in northwest Vermont.
| MEDIAN SALE PRICE | VS 2019 | UNITS SOLD | VS 2019 | NEWLY LISTED | VS 2019 | DAYS ON MARKET | |
|---|---|---|---|---|---|---|---|
| Addison County Single-Family | $260,000 | 2.70% | 127 | -16.50% | 210 | -27.80% | 147 |
| Addison | $289,000 | 9.10% | 7 | -22.20% | 11 | -48% | 130 |
| Bridport | $80,000 | -68.90% | 3 | -40.00% | 7 | -30.00% | 300 |
| Bristol | $225,000 | -17.40% | 13 | -13.30% | 27 | 17.40% | 104 |
| Cornwall | $310,000 | -21.10% | 3 | 0.00% | 10 | 66.70% | 104 |
| Ferrisburgh | $224,500 | 9.50% | 12 | -36.80% | 30 | 7.10% | 182 |
| Goshen | $270,000 | 160.30% | 1 | -66.70% | n/a | n/a | 172 |
| Granville | n/a | n/a | n/a | n/a | 3 | -25.00% | |
| Hancock | $100,000 | -58.30% | 1 | 0.00% | 4 | -20.00% | 27 |
| Leicester | $95,500 | -50.70% | 6 | 50.00% | 5 | -50.00% | 177 |
| Lincoln | $133,000 | -30.60% | 3 | -50.00% | 6 | -53.90% | 173 |
| Middlebury | $285,500 | 5.70% | 24 | -20.00% | 33 | -37.70% | 146 |
| Monkton | $335,000 | 37.40% | 7 | -12.50% | 16 | 14.30% | 53 |
| New Haven | $219,000 | -35.60% | 3 | 0.00% | 9 | 12.50% | 149 |
| Orwell | $225,000 | 76.10% | 5 | 25% | 5 | -64.30% | 185 |
| Panton | $220,000 | -61.80% | 3 | -57.10% | 2 | -77.80% | 94 |
| Ripton | $40,000 | -80.00% | 1 | -80.00% | 5 | 25.00% | 61 |
| Salisbury | $255,000 | -27.10% | 5 | 66.70% | 4 | -63.60% | 111 |
| Shoreham | $342,500 | 42.70% | 4 | -33% | 6 | -62.50% | 446 |
| Starksboro | $370,000 | 51.00% | 5 | 0.00% | 11 | 37.50% | 110 |
| Vergennes | $271,000 | 23.20% | 13 | 44.40% | 11 | -54.20% | 102 |
| Waltham | $279,000 | 100.70% | 3 | 0.00% | 1 | -66.70% | 101 |
| Weybridge | $271,000 | -66.10% | 4 | 33.30% | 3 | -25.00% | 275 |
| Whiting | $118,000 | n/a | 1 | n/a | 1 | n/a | 15 |
