| Single-Family January-June 2021 | ||||
|---|---|---|---|---|
| Median Sale Price: | Average Sale Price: | Units Sold: | Newly Listed: | Days on Market: |
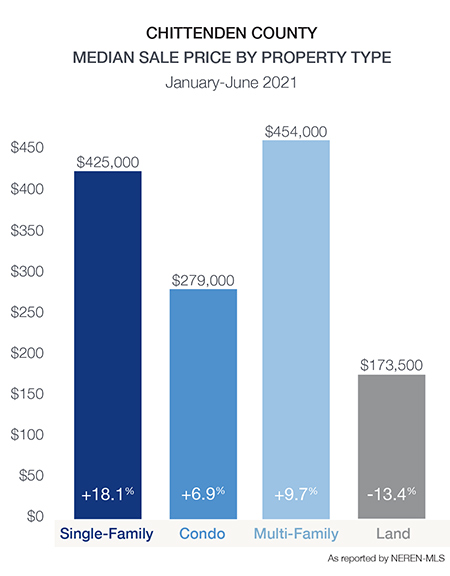
| $425,000 +18.1% | $501,218 +19.2% | 532 +13.4% | 777 +8.2% | 32 -42% |
| Condo January-June 2021 | ||||
|---|---|---|---|---|
| Median Sale Price: | Average Sale Price: | Units Sold: | Newly Listed: | Days on Market: |
| $279,000 +6.9% | $316,944 +11.1% | 279 -0.4% | 381 +7.6% | 35 -38% |
The demand for homes in Chittenden County continued through the first half of 2021, increasing by more than 13% over 2020. Navigating the challenges of the global pandemic in 2020, many contemplated their living and employment situations; either relocating, right-sizing, or renovating their home. A modest improvement in the number of properties listed for sale this year (+8%) has not proven enough to satisfy the number of buyers searching for a home.
Many purchasers, facing multiple offers, needed to exercise patience and heed the guidance of their REALTOR before entering into a contract to purchase. In most cases, persistence paid off, and buyers found the home that met their needs.
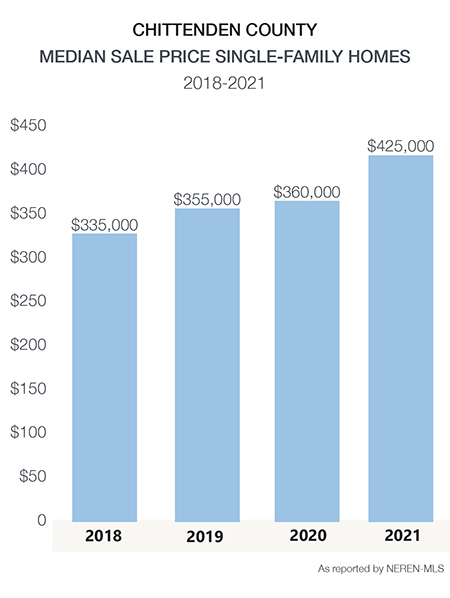
The median sale price of single-family homes in Chittenden County jumped 18% in 2021, increasing 27% since 2018. Still, homes remain an affordable option over renting, with record-low mortgage interest rates offering the opportunity to build equity.
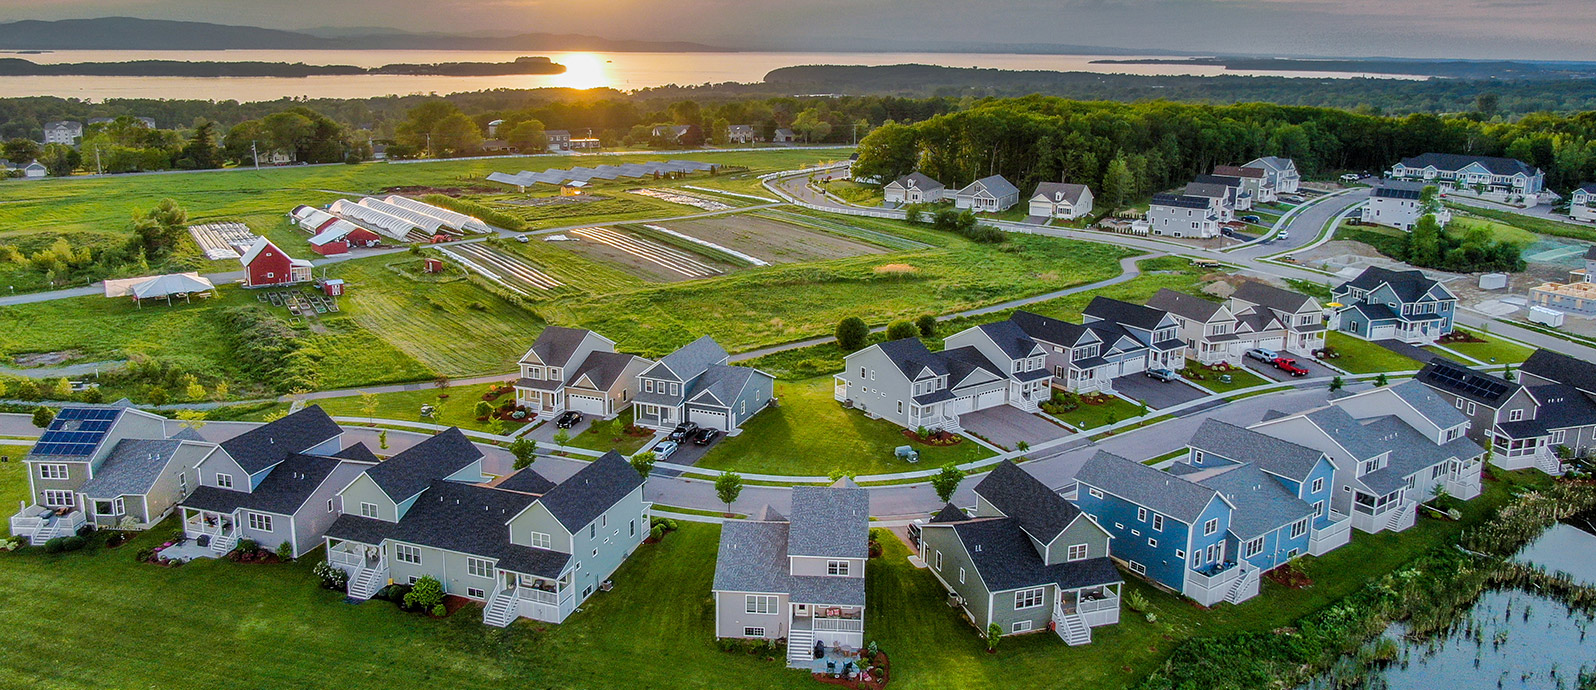
New construction projects such as South Village and Hillside at O’Brien Farm, both in South Burlington, introduced a variety of much needed, new housing options to the market – including townhomes, single-family homes, carriage homes, and “flats.” Buyers had time to make selections in location, floorplans, and custom finishes while not competing in the frenzied re-sale market. New construction projects throughout the county gave an opportunity for exiting homeowners to use their strong equity position and “right-size” to a new, energy-efficient, and low-maintenance home. Options for new builds are still available with Spring 2022 delivery dates for buyers with flexible timelines.


| SALE PRICE MEDIAN | VS 2020 | UNITS SOLD | VS 2020 | NEWLY LISTED | VS 2020 | DAYS ON MARKET | |
|---|---|---|---|---|---|---|---|
| Chittenden County Single-Family | $425,000 | 18.1% | 532 | 13.4% | 777 | 8.2% | 32 |
| Bolton | $280,000 | 17.9% | 2 | 0.0% | 3 | -50.0% | 7 |
| Burlington | $450,000 | 34.3% | 79 | 21.5% | 123 | 30.9% | 17 |
| Charlotte | $630,000 | -16.0% | 17 | -19.1% | 29 | -27.5% | 74 |
| Colchester | $437,500 | 18.6% | 54 | -20.6% | 84 | -5.6% | 95 |
| Essex | $360,000 | 4.1% | 79 | 12.9% | 109 | 5.8% | 18 |
| Hinesburg | $456,000 | 14.1% | 14 | 16.7% | 21 | 10.5% | 44 |
| Huntington | $387,000 | 33.5% | 5 | -28.6% | 8 | -27.3% | 29 |
| Jericho | $482,699 | 29.5% | 22 | 83.3% | 34 | 17.2% | 35 |
| Milton | $350,000 | 12.2% | 46 | 15.0% | 75 | 31.6% | 13 |
| Richmond | $505,000 | 22.6% | 5 | -61.5% | 16 | -11.1% | 14 |
| Shelburne | $669,875 | 3.1% | 48 | 152.6% | 56 | 55.6% | 31 |
| South Burlington | $509,638 | 10.1% | 82 | 28.1% | 111 | 5.7% | 27 |
| St. George | $552,720 | 22.3% | 7 | -22.2% | 7 | -30.0% | 15 |
| Underhill | $320,000 | -22.0% | 5 | -44.4% | 9 | -57.1% | 15 |
| Westford | $357,000 | 10.5% | 11 | -15.4% | 14 | -22.2% | 48 |
| Williston | $474,845 | 31.9% | 37 | 27.6% | 50 | 8.7% | 30 |
| Winooski | $324,000 | -0.3% | 19 | 18.8% | 28 | 75.0% | 23 |
| SALE PRICE MEDIAN | VS 2020 | UNITS SOLD | VS 2020 | NEWLY LISTED | VS 2020 | DAYS ON MARKET | |
|---|---|---|---|---|---|---|---|
| Chittenden County Condo | $279,000 | 6.90% | 279 | -0.40% | 381 | 7.60% | 35 |
| Bolton | $169,000 | 33.60% | 5 | -37.50% | 4 | -60.00% | 3 |
| Burlington | $280,000 | -12.80% | 44 | 10.00% | 56 | 0.00% | 35 |
| Charlotte | $369,450 | 0.00% | 2 | 0.00% | 4 | 0.00% | 4 |
| Colchester | $260,000 | 5.70% | 35 | -5.40% | 42 | -2.30% | 58 |
| Essex | $223,500 | 4.20% | 58 | 16.00% | 72 | 20.00% | 36 |
| Hinesburg | $322,675 | 12.60% | 6 | 500.00% | 6 | 0.00% | 16 |
| Jericho | $512,788 | 20.50% | 3 | -50.00% | 4 | -33.30% | 12 |
| Milton | $242,000 | 3.00% | 11 | -21.40% | 13 | -23.50% | 7 |
| Richmond | $296,500 | 0.00% | 2 | 0.00% | 1 | 0.00% | 41 |
| Shelburne | $385,000 | -16.10% | 11 | -21.40% | 13 | -13.30% | 50 |
| South Burlington | $309,500 | 26.30% | 70 | -10.30% | 124 | 22.80% | 42 |
| Williston | $369,000 | 23.00% | 23 | 9.50% | 26 | -10.30% | 11 |
| Winooski | $287,000 | 10.40% | 9 | -18.20% | 16 | -5.90% | 6 |
