| Single-Family January-December 2021 | ||||
|---|---|---|---|---|
| Median Sale Price: | Average Sale Price: | Units Sold: | Newly Listed: | Days on Market: |
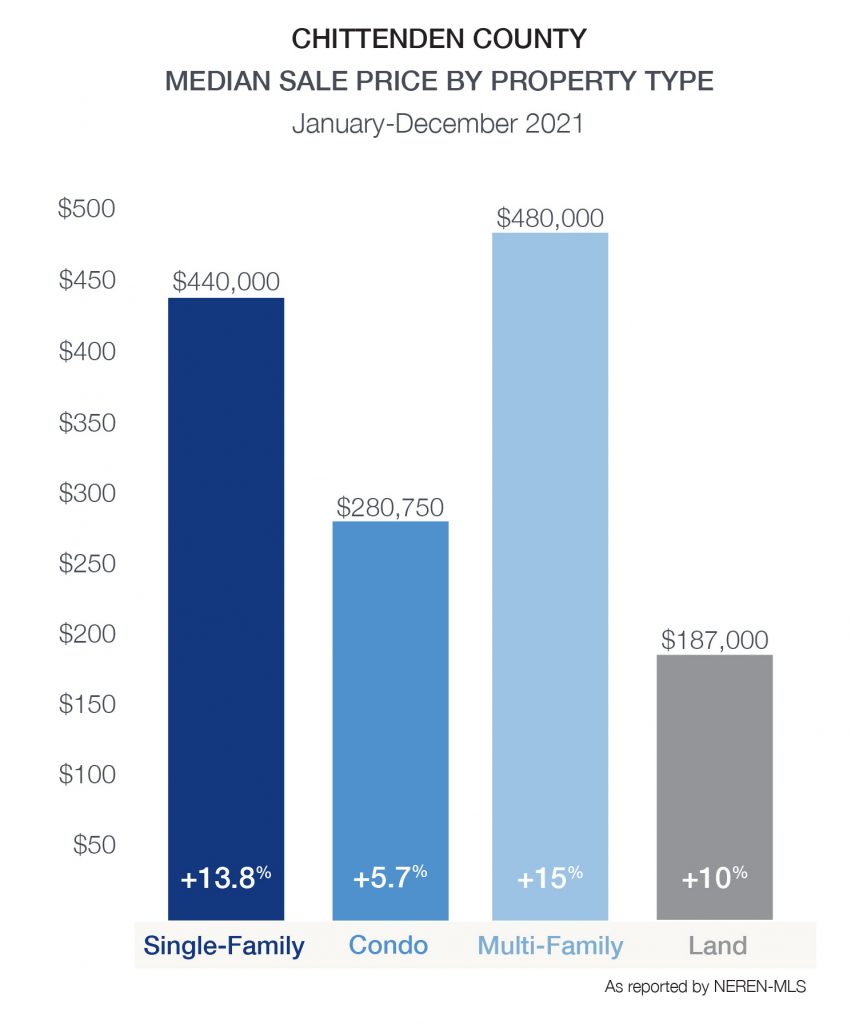
| $440,000 +13.8% | $516,951 +14.1% | 1400 +4.1% | 777 +8.2% | 26 -40.9% |
| Condo January-December 2021 | ||||
|---|---|---|---|---|
| Median Sale Price: | Average Sale Price: | Units Sold: | Newly Listed: | Days on Market: |
| $280,750 +5.7% | $323,671 +11% | 666 -7.5% | 693 -3.8% | 29 -34.1% |
The demand for homes in Chittenden County remained strong throughout 2021. The modest increase in the number of homes sold during the year was a result of the limited and fast-moving inventory and not a reflection of the number of buyers participating in the market. Many purchasers faced multiple offers, needing to exercise patience and persistence, while working closely with their REALTOR, to close on a home that met their needs.
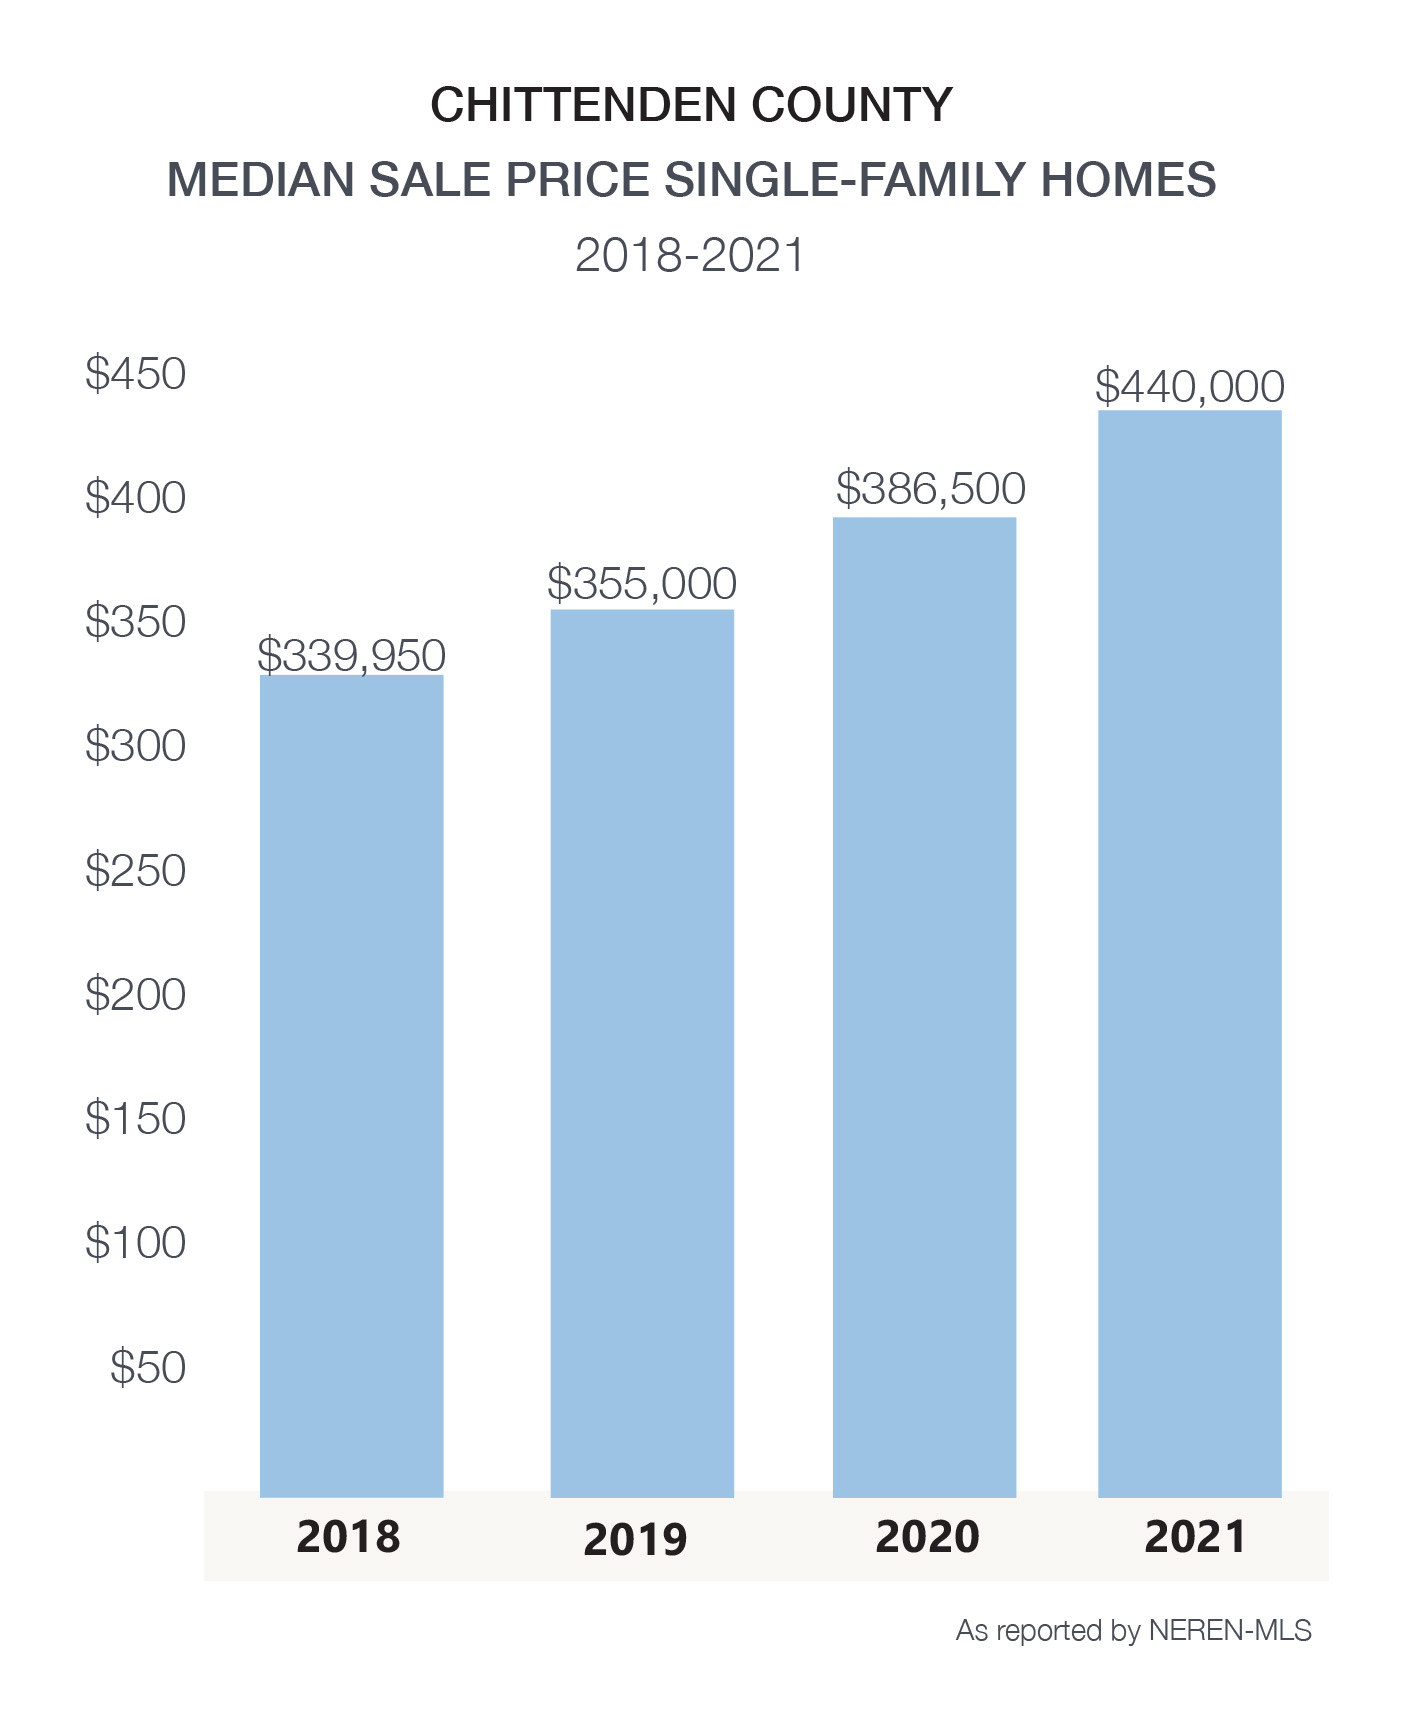
The median and average sale price increased for both single-family homes and condominiums again in 2021. With the prices of homes increasing by 29% over the past 4 years, homeowners have built equity, while keeping the largest portion of their housing expenses – their mortgage – reasonably stable. For this reason, buyers should remain in the market. The opportunities to build wealth, manage your housing expenses, and enjoy the many benefits of home ownership simply do not exist as a renter.
New construction projects such as Hillside at O’Brien Farms and South Village in South Burlington are nearing the end of their current phases of development – with Hillside preparing to offer additional homes in the near future. New construction projects throughout the county offer an opportunity for existing homeowners to use their strong equity position to “right-size” and for buyers who have a flexible timeline to purchase a new, energy-efficient, and low maintenance home.
 Burlington, Essex, and South Burlington lead the county for closed sales while Hinesburg and Winooski posted the largest increases in closed units in 2021. With a relatively affordable median price, proximity to nearby Burlington, and a vibrant downtown the mill town of Winooski continues to be a desirable option for first time buyers.
Charlotte and Shelburne posted the highest median price in the county driven, in part, by the lakefront and luxury homes available.
Chittenden County offers a variety of housing options including a large number of condominiums. The median sale price for condos across the county rose slightly to $280,000 providing an affordable and low maintenance housing option for buyers.

| SALE PRICE MEDIAN | VS 2020 | UNITS SOLD | VS 2020 | NEWLY LISTED | VS 2020 | DAYS ON MARKET | |
|---|---|---|---|---|---|---|---|
| Chittenden County Single-Family | $440,000 | 13.80% | 1400 | 4.10% | 1506 | 0.70% | 26 |
| Bolton | $364,950 | 30.60% | 6 | -40.00% | 7 | -41.70% | 20 |
| Burlington | $450,500 | 18.60% | 210 | 0.00% | 232 | 5.50% | 19 |
| Charlotte | $650,000 | 2.90% | 40 | -35.50% | 46 | -30.30% | 61 |
| Colchester | $445,704 | 13.70% | 156 | -1.30% | 172 | 0.60% | 56 |
| Essex | $400,000 | 9.20% | 203 | 5.70% | 228 | 1.80% | 13 |
| Hinesburg | $437,500 | 9.40% | 46 | 58.60% | 43 | 13.20% | 28 |
| Huntington | $387,000 | 50.90% | 17 | -22.70% | 21 | -4.60% | 25 |
| Jericho | $500,000 | 23.80% | 58 | 9.40% | 62 | -3.10% | 27 |
| Milton | $353,000 | 11.90% | 129 | 13.20% | 135 | 6.30% | 23 |
| Richmond | $527,500 | 37.00% | 28 | -24.30% | 35 | 0.00% | 12 |
| Shelburne | $679,750 | 9.60% | 97 | 34.70% | 100 | 17.70% | 27 |
| South Burlington | $520,000 | 8.80% | 196 | 9.50% | 192 | -10.70% | 24 |
| St. George | $552,720 | 22.30% | 11 | 22.20% | 9 | -10.00% | 15 |
| Underhill | $450,000 | 25.00% | 27 | -25.00% | 29 | -17.10% | 13 |
| Westford | $408,500 | 10.40% | 26 | -21.20% | 24 | -20.00% | 33 |
| Williston | $549,800 | 14.50% | 94 | 3.30% | 107 | 1.90% | 19 |
| Winooski | $343,750 | 12.50% | 56 | 47.40% | 64 | 73.00% | 16 |
| MEDIAN SALE PRICE | VS 2020 | UNITS SOLD | VS 2020 | NEWLY LISTED | VS 2020 | DAYS ON MARKET | |
|---|---|---|---|---|---|---|---|
| Chittenden County Condo | $280,750 | 5.70% | 666 | -7.50% | 693 | -3.80% | 29 |
| Bolton | $198,050 | 65.70% | 12 | -29.40% | 11 | -35.30% | 4 |
| Burlington | $301,000 | 3.80% | 107 | -2.70% | 105 | -12.50% | 23 |
| Charlotte | $435,000 | n/a | 4 | n/a | 4 | n/a | 33 |
| Colchester | $265,000 | -8.30% | 77 | -7.20% | 81 | 8.00% | 40 |
| Essex | $252,600 | 6.80% | 139 | 2.20% | 129 | -6.50% | 21 |
| Hinesburg | $276,944 | 22.70% | 12 | 500.00% | 9 | 125.00% | 41 |
| Jericho | $303,000 | 9.20% | 10 | -28.60% | 10 | -28.60% | 14 |
| Milton | $247,250 | 5.20% | 20 | -25.90% | 22 | -15.40% | 22 |
| Richmond | $296,500 | 20.80% | 2 | 0.00% | 1 | -66.70% | 41 |
| Shelburne | $289,077 | -5.30% | 25 | -19.40% | 32 | 14.30% | 29 |
| South Burlington | $282,000 | 15.10% | 191 | -8.20% | 215 | 9.70% | 43 |
| Williston | $351,000 | 14.20% | 46 | -25.80% | 50 | -24.20% | 13 |
| Winooski | $305,000 | 16.40% | 21 | -22.20% | 24 | -25.00% | 13 |
