Mid-Year 2022 Market Report

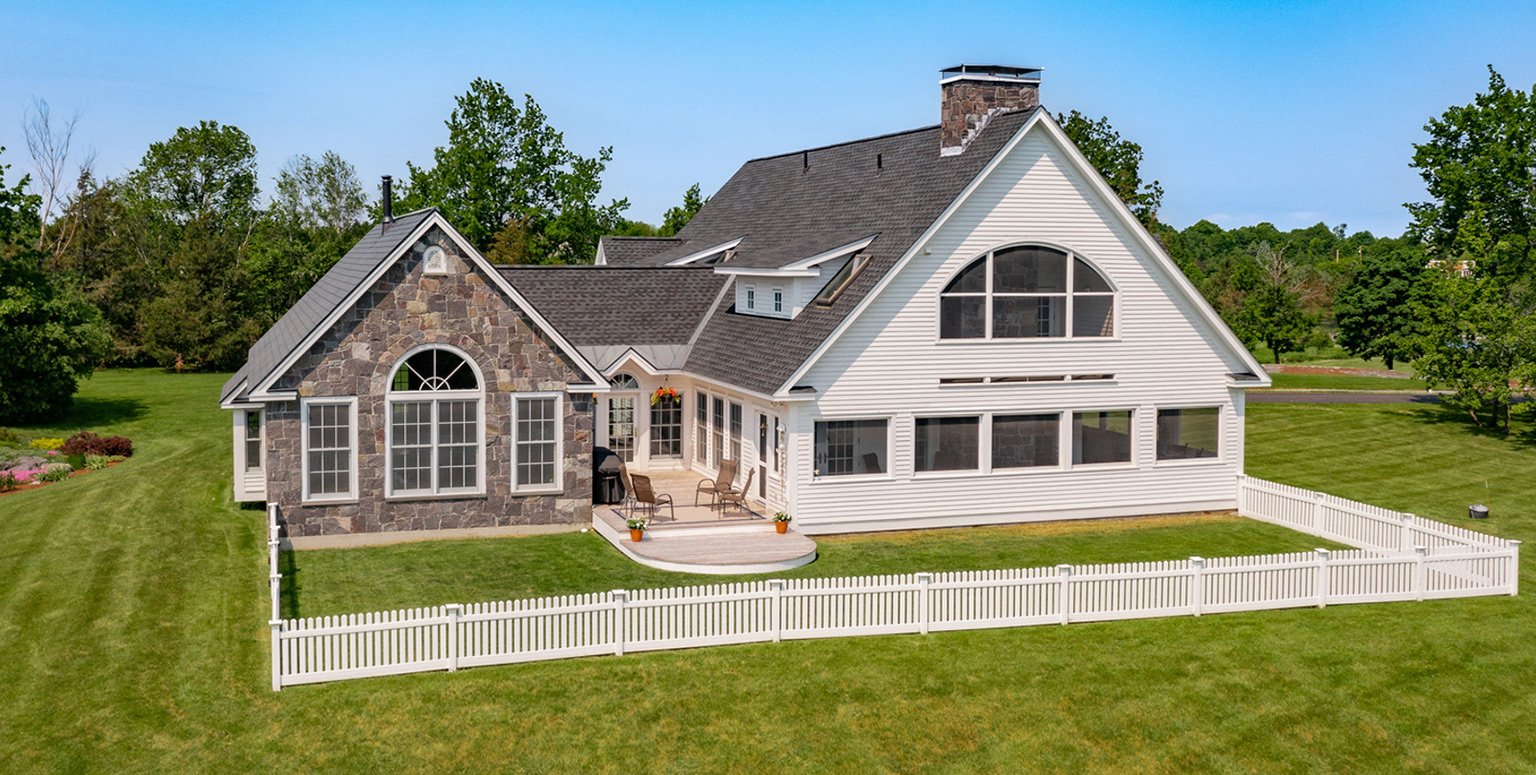
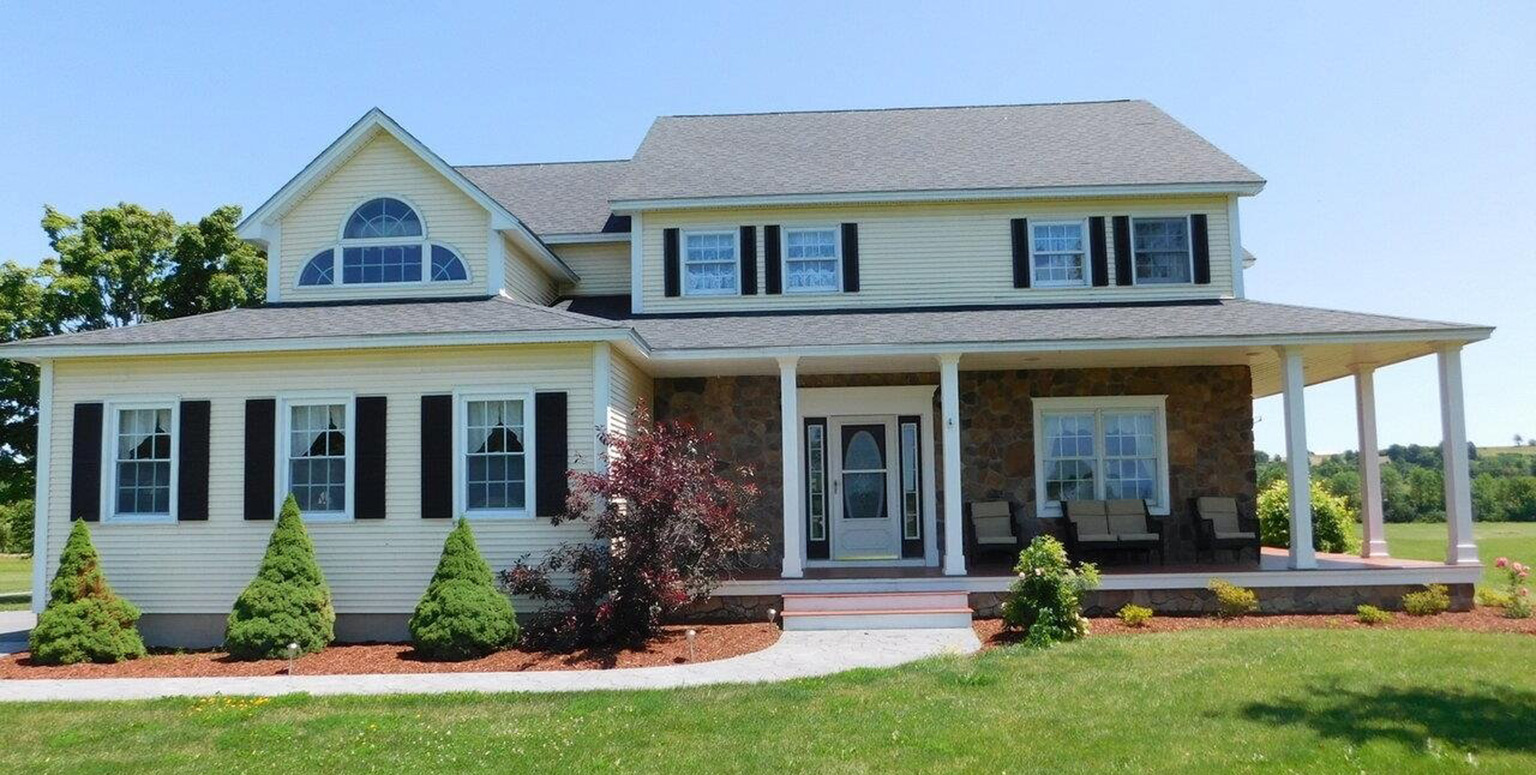
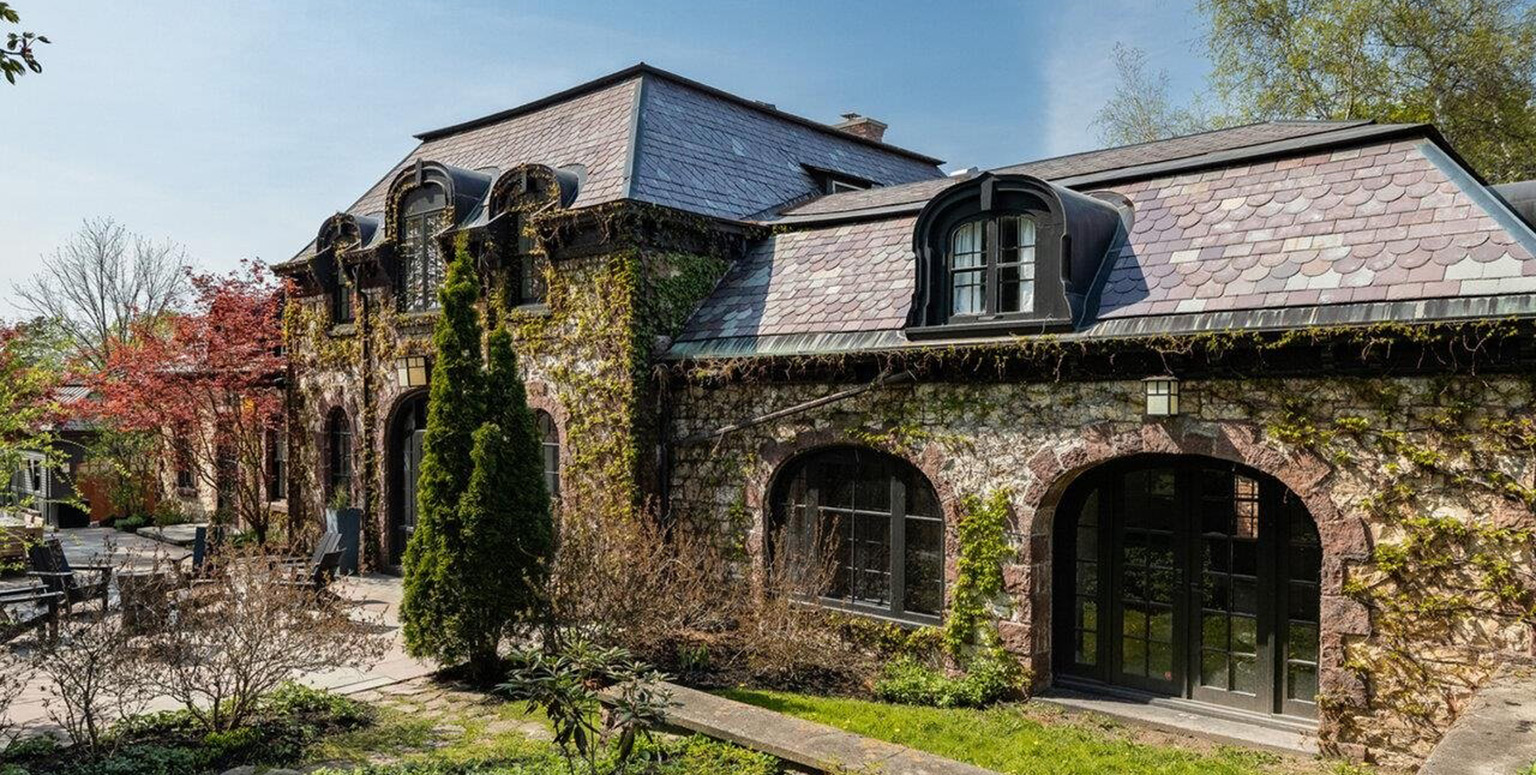
189 Cliff Street, Burlington, Vermont ~ Welcome to one of Burlington’s most unique and historic homes! The building features a striking redstone exterior with iconic arched doorways and dormers, a slate mansard-hipped roof, and numerous oversized windows.

As we reach the midpoint of 2022, the real estate market is in the initial steps of a transition. The market statistics included in this report reflect transactions closed from January through June 2022. Typical transactions close approximately 45 days from executing a Purchase and Sale contract, which means most of the year-to-date data reflects sales written between November 2021 and mid-May 2022.

Single-Family January-June 2022
Median Sale Price:Average Sale Price:Units Sold:Newly Listed:Days on Market:
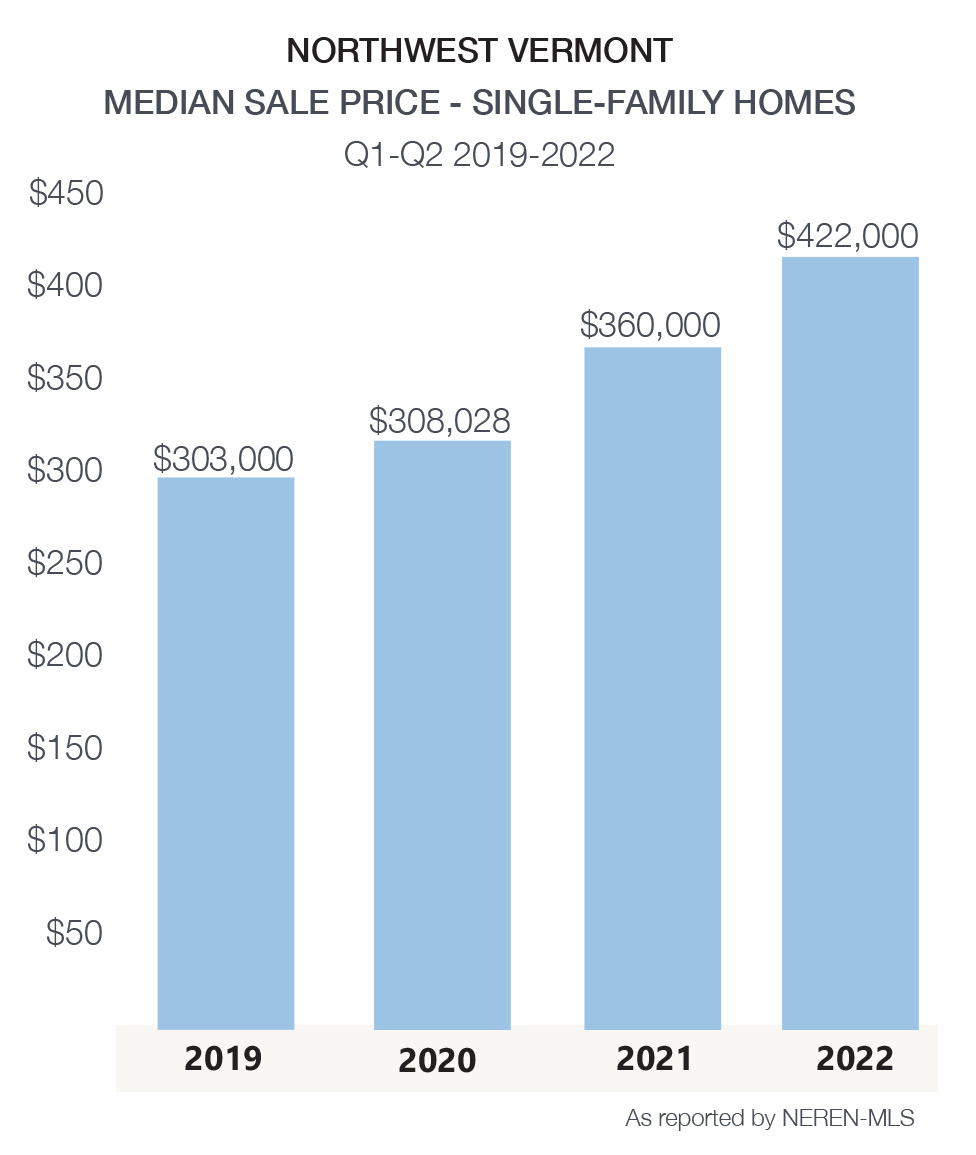
$422,000 +17.2%
$500,855 +20.1%
919 -15.8%1,266 -16.6%28 -44%
Condo January-June 2022
Median Sale Price:Average Sale Price:Units Sold:Newly Listed:Days on Market:
$335,000 +21.8% $379,809 +21.9%
344 +8.9%
411 -8.7%
23 -32.4%
Multi-Family January-June 2022
Median Sale Price:Average Sale Price:Units Sold:Newly Listed:Days on Market:
$494,500 +19%
$540,468 +14.6%
106 0%
142 -14.5%
49 -9.3%


Land January-June 2022
Median Sale Price:Average Sale Price:Units Sold:Newly Listed:Days on Market:
$147,000 +54.7% $210,463 +46%127 -27.4%189 -14.1%159 -31.2%

2021, the second year of the pandemic, saw record-setting in sales volume and capped two years of record price appreciation in real estate sales. The impact of the pandemic, coupled with historically low mortgage interest rates in the low 3% range, drove sales up and inventory levels to new record lows to start 2022.

Now approaching mid-summer, several factors have changed. Annual inflation, which began in 2021 in the 6% range, increased to 8.6% in May 2022. In reaction, the Federal Reserve raised its benchmark interest rates three-quarters of a percentage point – its most aggressive hike since 1994. The benchmark rate is anticipated to end the year with an upward revision of 1.5 percentage points from the March estimate.

The Feds’ action, worry of high inflation, and some developing fears of recession spurred a rapid rise in mortgage rates spiking to over 6.0% in May, and a 30-year fixed-rate mortgage average of 5.7% as of June 30, 2022. A year ago, at this time, the 30-year fixed rate mortgage averaged 2.98%. Higher interest rates on top of two years of rapid price appreciation have impacted housing affordability and reduced consumers buying power. In addition, inflation is outpacing most workers’ pay raises, making discretionary purchases and saving more challenging.

Based on affordability, housing markets are headed for a reset. Some buyers, considering higher financing costs, have elected to refocus their home search in lower price ranges. Agents report fewer cash offers and more buyers with financing terms or other contingencies. Multiple offers are still common yet may include less competition.
Despite these changes, the year-to-date median sale price increase reported nationally hit a new record of $450,000 in June, a 17% gain from last year. Our local market median sale price of single-family homes was a record $422,000, also a 17% increase from 2021. This accelerated rate is not forecasted to continue at the same pace for the second half of 2022.

However, the ongoing shortage of homes, especially here in Vermont, will keep pressure on prices until inventory slowly increases. Most economists are projecting price appreciation at 8.5% for 2022.

The number of new listings coming on the market in Northwest Vermont continues to lag. There were 16.6% fewer single-family new listings in Chittenden County year to date vs. 2021. Addison, Grand Isle, and Franklin County also saw declines. New construction has not kept up with demand for years, locally or nationally, and the delta of housing needed is just growing.

Several factors are affecting the volume of new listings. Many homeowners have low-interest rate mortgages on their existing properties. Today’s higher rates don’t allow them to replicate that in a new purchase.

Continued low inventory limits choice, and that deters some homeowners. However, some sellers, having delayed their plans through the pandemic, are observing slowing buyer demand and declining housing affordability, prompting them to list their homes before conditions shift further. Homeowners have accrued substantial equity over the past 28 months, and many want to capitalize on that. We anticipate listings to return to more traditional levels gradually.

As previously noted, some buyers adjusted their buying power. A few have temporarily stepped out of the market; however, many are still actively pursuing the right home. The rental market in Vermont, especially in Chittenden County, continues to tighten. In June 2022, Allen, Brooks & Minor reported the Chittenden County apartment vacancy rate at 0.4%. Many renters, impacted by limited availability and rising rents, are increasingly focused on homeownership.

In May and June, inventory has risen nationally, offering buyers more choice. Although Vermont often lags other markets, we anticipate that price appreciation will slow, and properties will begin to come to market at a quicker pace. The number of transactions is moderating and even declining in some categories. In time, Buyers and Sellers will find themselves on more equal footing, a welcome shift after two years of a severely lopsided market throughout the pandemic.

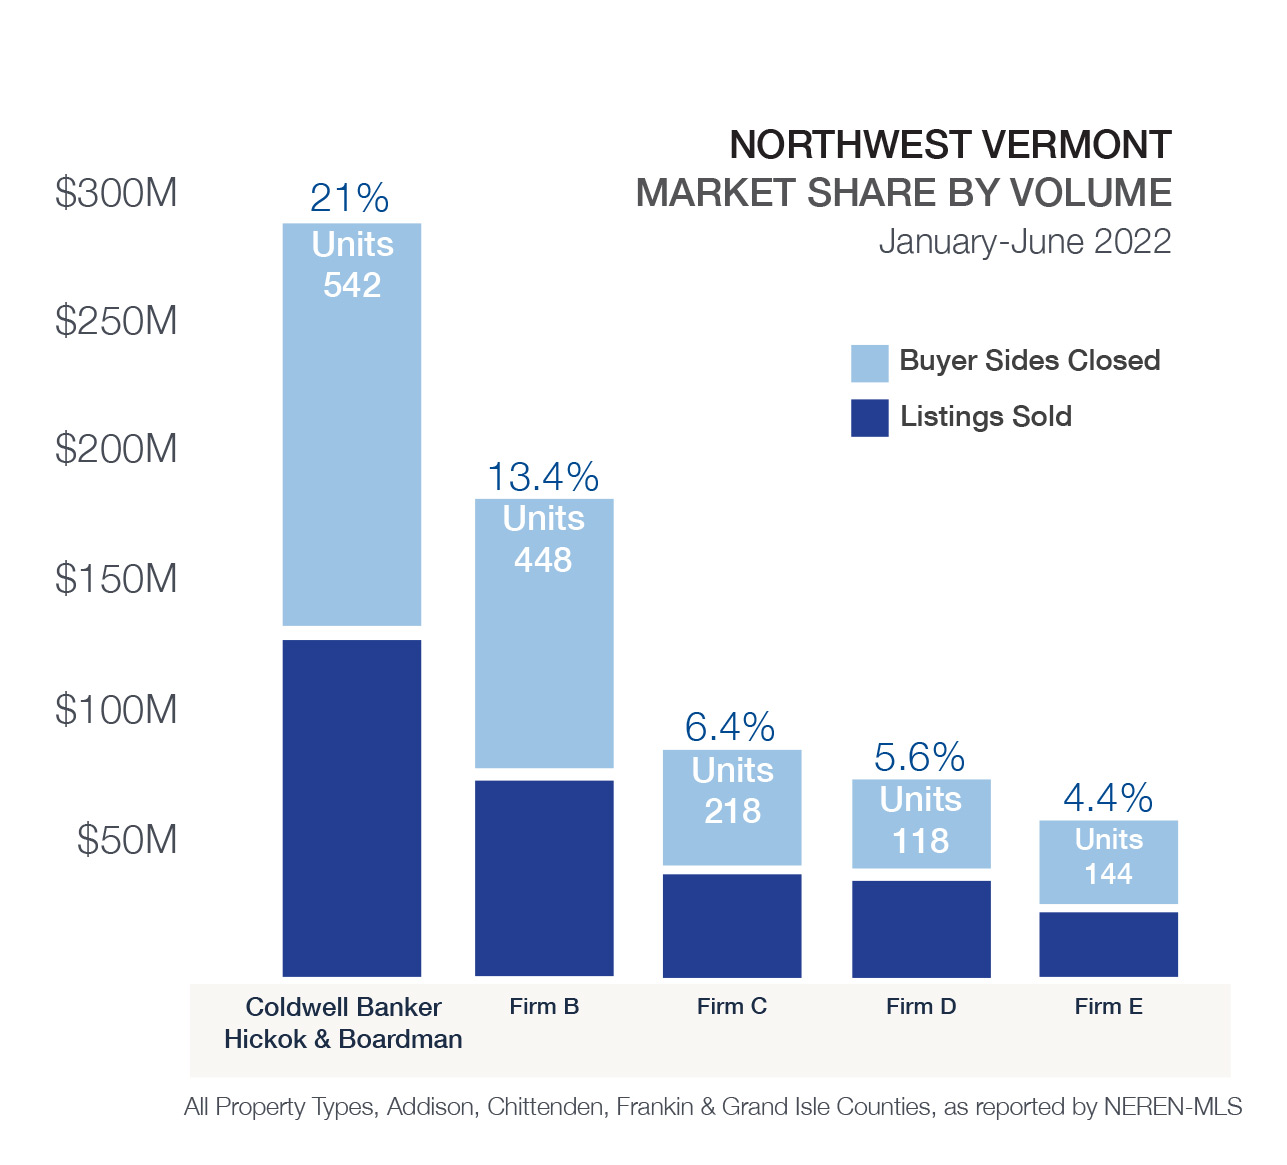
How can Buyers and Sellers best navigate our current conditions? Actively consult your agent and your lender. Some Buyers who anticipate living in their desired home for a shorter period are considering an adjustable-rate mortgage. On the sell side, our Agents work diligently with their clients to prepare homes for market, customize marketing strategies, and target pricing to address the changing conditions. Our Agents, through their skill, knowledge, and kindness, will help you achieve a better financial outcome. Not to mention – with less stress.

Washington County Market Results

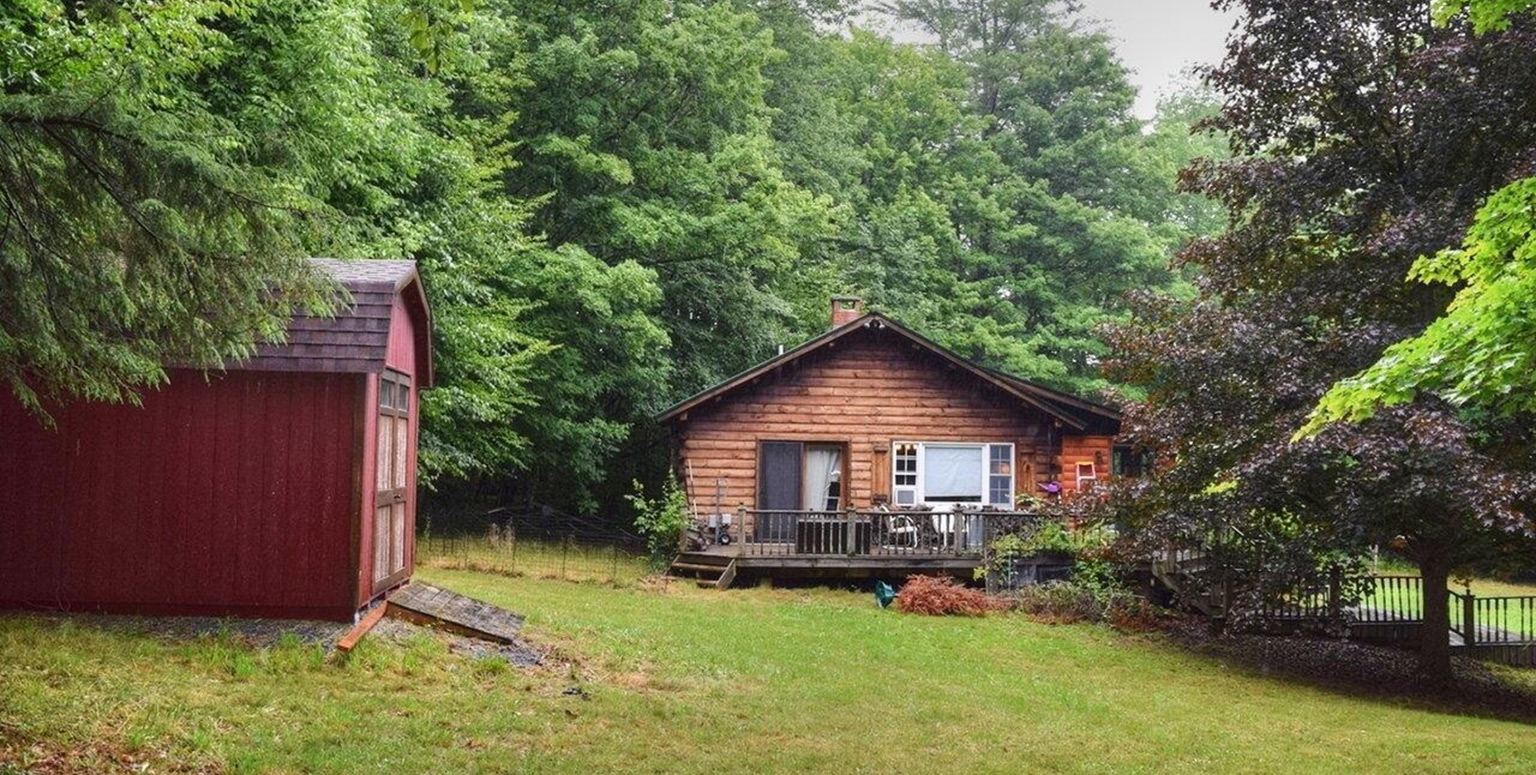
907 Hathaway Road, Moretown, VT ~ Cute as a button 2 bedroom log home with private yard, open floor plan, high ceilings, woodstove, and shed.
Single-Family January-June 2022
Median Sale Price:Average Sale Price:Units Sold:Newly Listed:Days on Market:
$313,000 6.2% $378,245 9.9%245 -15.8%320 -23.3%42 -22.2%
Condo January-June 2022
Median Sale Price:Average Sale Price:Units Sold:Newly Listed:Days on Market:
$270,750 27.7% $350,597 49.5%60 -18.9%75 -11.8%23 -61.0%

With easy access to I-89 for commuting north or south, and an affordable media sale price, we are happy to include Washington County in our Vermont Market Report. City living, proximity to ski resorts, and country property – Washington County offers diverse housing options.

Washington County All Property Types
MEDIAN SALE PRICEVS 2021UNITS SOLDVS 2021NEWLY LISTEDVS 2021AVERAGE DAYS ON MARKET
Barre City$223,500 11.8%4811.6%44-30.2%38
Barre Town
$284,200 6.6%50-19.4%60-30.0%53
Berlin
$299,000 -7.3%13-27.8%11-52.2%43
Cabot
$649,500 220.7%6-50.0%7-46.2%98
Calais
$250,000 53.0%8-56.0%--95
Duxbury
$327,500 -1.5%6-25.0%4-55.6%51
East Montpelier
$425,000 17.3%9-30.8%1536.4%37
Fayston
$505,000 67.2%11-26.7%120.0%25
Marshfield
$415,000 26.9%5-28.6%912.5%12
Middlesex
$405,500 47.0%7-46.0%--34
Montpelier
$385,000 43.9%360.0%484.4%23
Moretown
$250,000 -32.5%5-58.3%8-52.9%71
Northfield
$220,000 -14.7%17-26.1%29-23.7%37
Plainfield
$284,293 -17.9%433.3%4-50.0%54
Waitsfield
$339,500 -33.4%13-13.3%15-40.0%41
Warren
$494,000 103.7%49-3.9%7134.0%23
Waterbury
$399,900 -27.2%13-35.0%28-28.2%27

Lamoille County Market Results

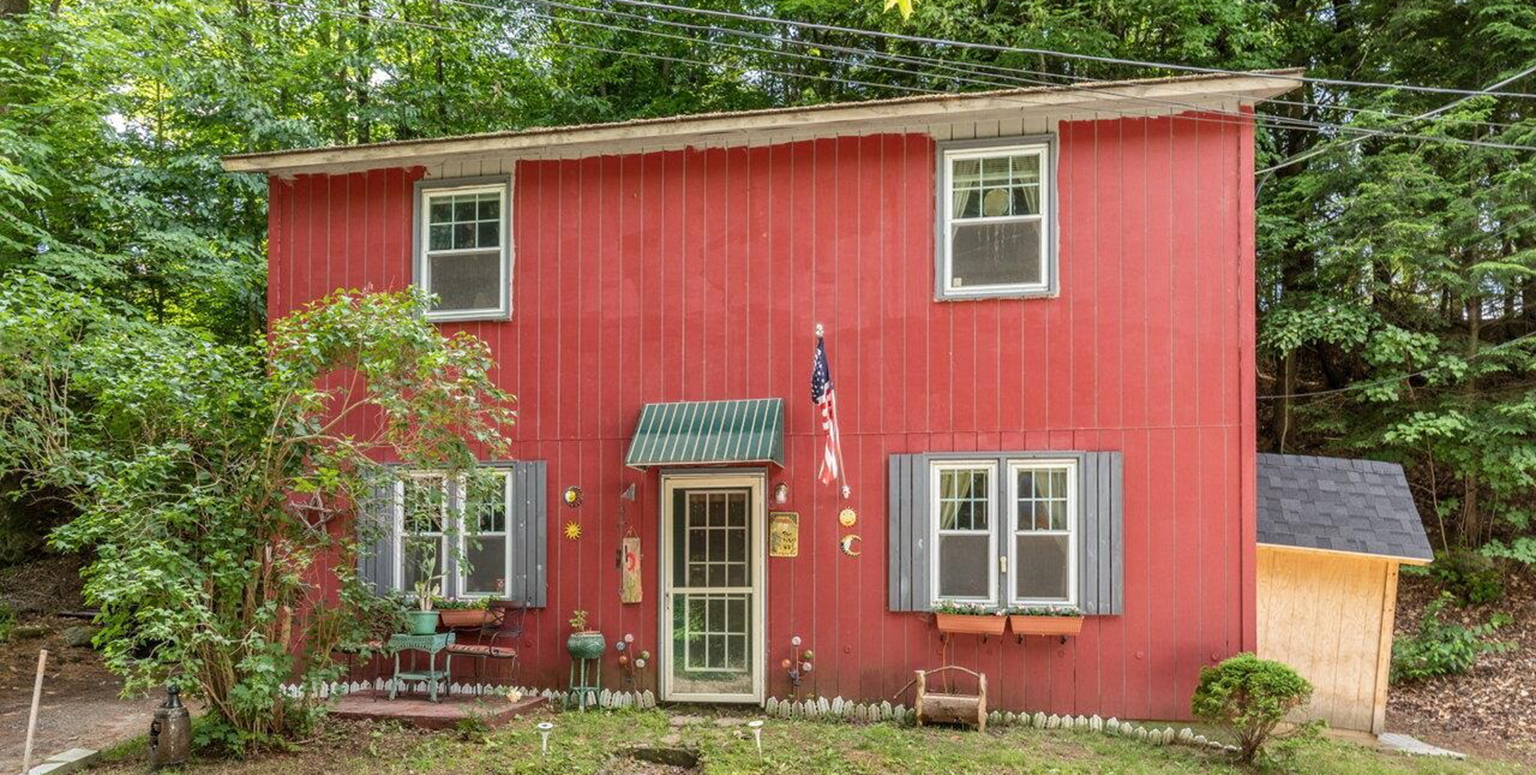
69 North River Street, Morristown, VT ~ This cozy home is close to the nightlife and amenities of downtown Morrisville, yet far enough away to feel removed from the hustle and bustle.
Single-Family January-June 2022
Median Sale Price:Average Sale Price:Units Sold:Newly Listed:Days on Market:
$435,000 +2.4% $679,947 +0.1%129 -12.8%209 +8.6%52 -45.0%
Condo January-December 2021
Median Sale Price:Average Sale Price:Units Sold:Newly Listed:Days on Market:
$437,500 +33.3% $667,472 +29.7%64 -11.0%85 +3.7%62 -50.0%

Although our Vermont Market Report has traditionally focused on Northwest Vermont, as inventory tightened and prices increased, more and more buyers looked to neighboring counties. Our Agents are able to provide market knowledge and skilled negotiation no matter where you search for your next Vermont property.

Lamoille County All Property Types
MEDIANSALE PRICEVS 2021UNITS SOLDVS 2021NEWLY LISTEDVS 2021AVERAGE DAYS ON MARKET
Cambridge
$216,000 -20.3%29-14.7%4410.0%61
Eden
$127,000 -25.2%1327.8%--111
Elmore
$302,500 28.7%14-12.5%--279
Hyde Park
$383,000 63.8%1623.1%24-17.2%58
Johnson
$377,000 39.6%9-25.0%2161.5%34
Morristown
$380,000 -10.6%3545.8%5230.0%47
Stowe
$822,500 15.9%80-23.1%1255.0%51

Land Market Results

This increase in demand absorbed some property that had been on the market for a while and encouraged land owners to list. That surge has subsided in 2022 with a 14% decrease in properties coming to market and a 27% decrease in sales.

MEDIAN SALE PRICEVS 2021UNITS SOLDVS 2021NEWLY LISTEDVS 2021DAYS ON MARKET
Northwest Vermont$147,000 54.7%127-27.4%189-14.1%159
Chittenden County$230,000 32.8%37-22.9%6416.4%137
Addison County$136,000 46.2%45-11.8%$42-36.4%210
Franklin County$99,000 62.3%29-48.2%$59-19.2%132
$90,375 0.4%16-20.0%24-7.7%116

New Construction

While there is still an appetite for homeowners to consider building their custom home, some builders may not be able to start the project for 2 – 3 years. This is affecting some land sales where land gains tax may be a factor in the event a primary residence is not completed within the prescribed timeframe.
A number of Developers have projects in the pipeline for late 2022 and 2023, which will provide much needed single-family and condominium inventory to the market. Still, more building is needed to satisfy demand.

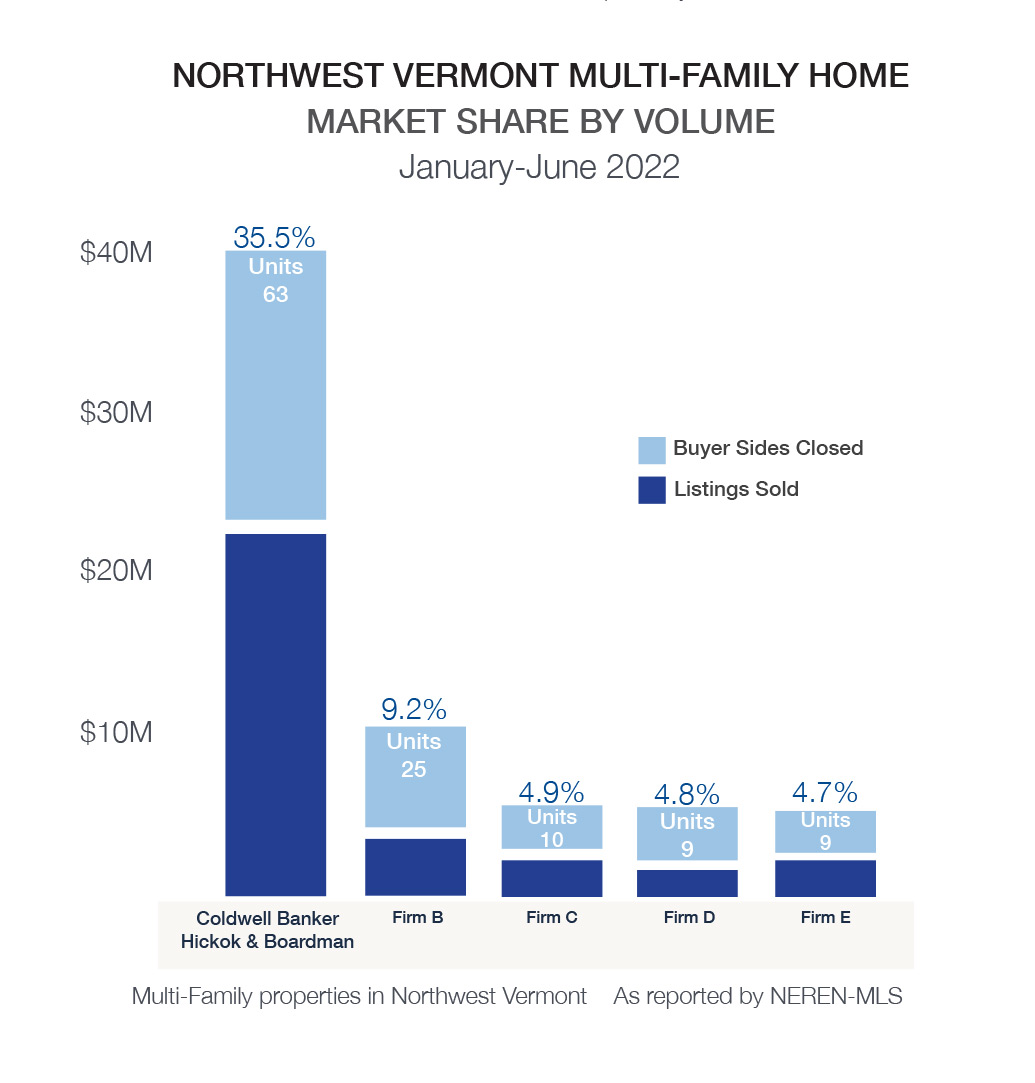
Multi-Family Home Market Results

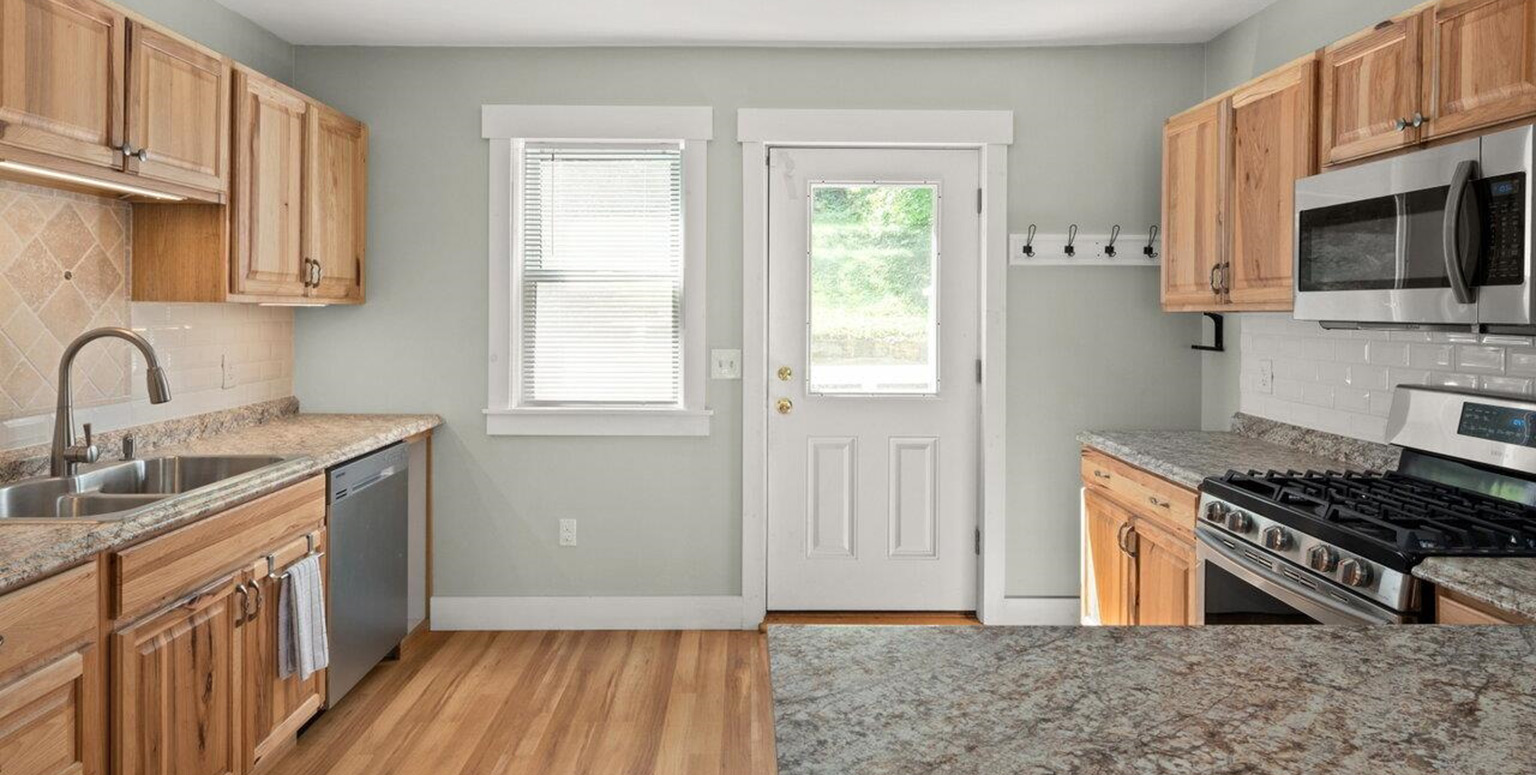
175 River Street, Montpelier, VT ~ This 100% renovated Duplex has been thoughtfully rebuilt from the ground up and is ready for a new owner/investor.
MEDIAN SALE PRICEVS 2021UNITS SOLDVS 2021NEWLY LISTEDVS 2021DAYS ON MARKET
Northwest Vermont Multi-Family$494,500 19.0%1060.0%142-14.5%49
Chittenden County$522,500 15.1%826.5%108-12.2%40
Addison County$425,000 4.9%5-28.6%1536.4%63
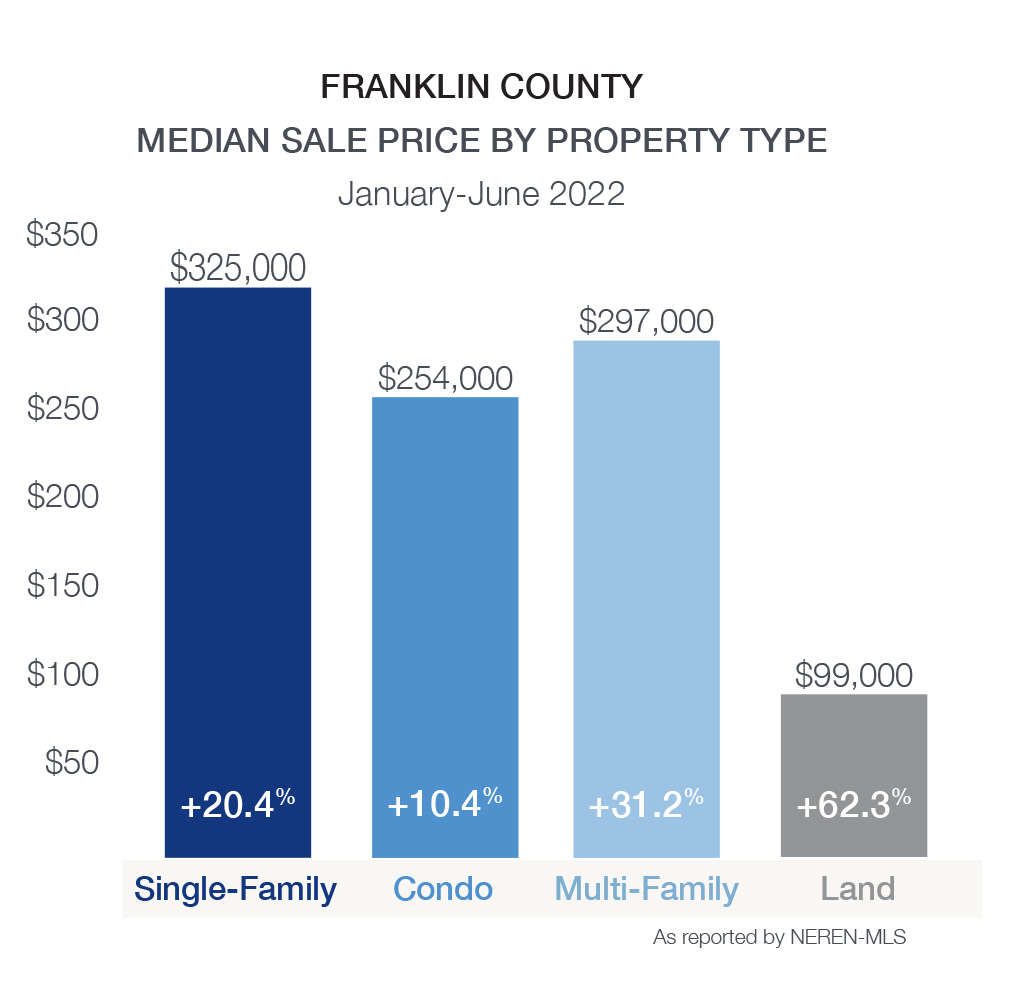
Franklin County$297,000 31.2%18-14.3%18-37.9%84
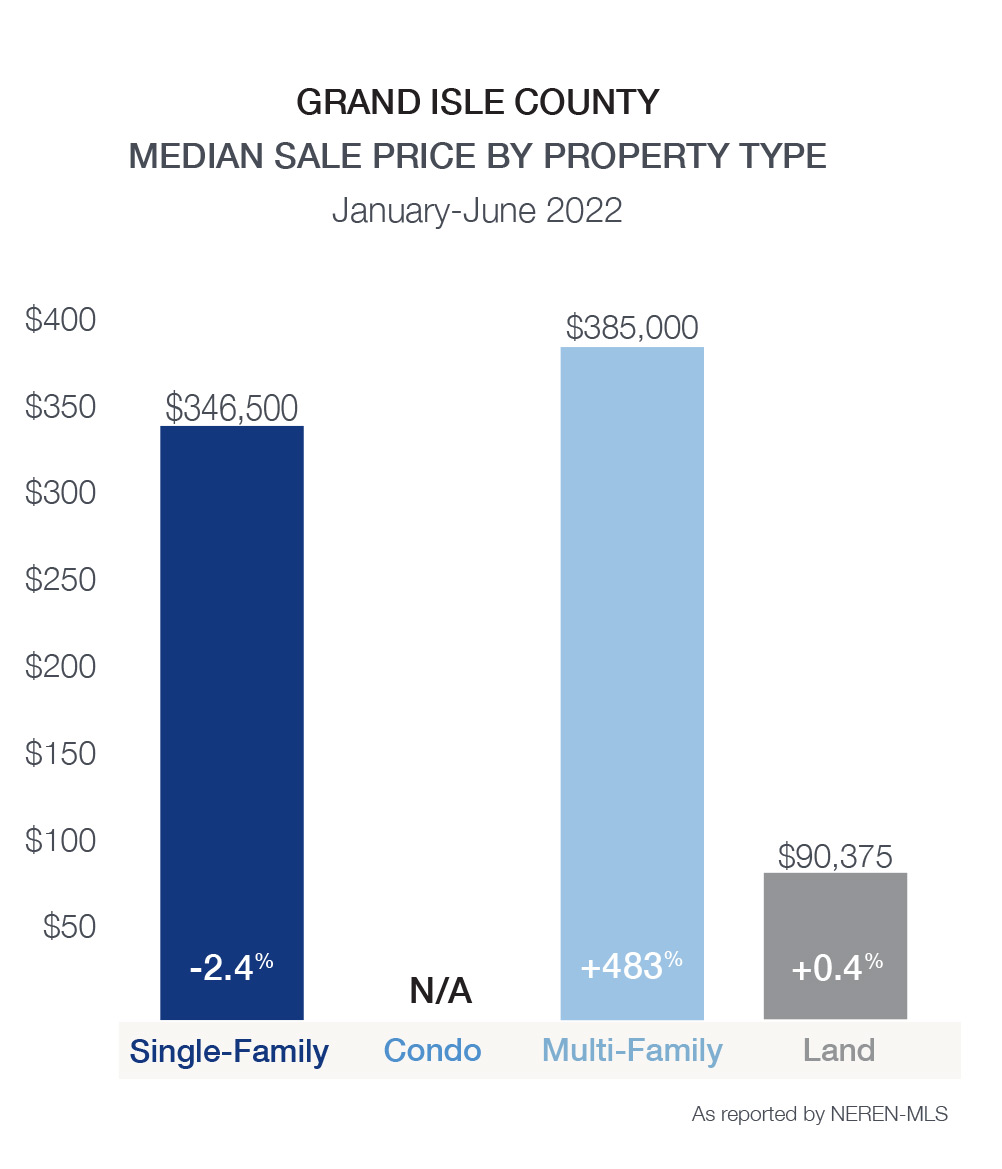
Grand Isle County$385,000 483.3%10.0%$1-66.7%29

The multi-family market continues to provide purchasers a more predictable investment opportunity vs. the stock market and other more volatile options. In the first half of 2022, 82 units sold in Chittenden County at a median sale price of $522,500, representing a 6.5% increase over 2021. Most multi-family properties, and therefore transactions, are in Chittenden County.

Rental Market Update

In 2020, rents were held level by many landlords focused on tenant retention during the pandemic. Now, in 2022 based on market conditions and tenant demand, there is significant upward pressure on rents. From the Allen, Brooks & Minor June 2022 report, the average 1 bedroom rent is $1309/month; 2 bedroom rent is $1534; 3 bedroom rent is $2120. The average increase from 2021 was approximately 3.8%. That is likely to sustain or increase in 2022.

Chittenden County, home to most of the region’s rental units, has a historically low vacancy rate. In June 2022, the Allen, Brooks & Minor report recorded a new historic low of 0.4%. The deficient number of available properties puts pressure on tenants to find suitable homes, despite 451 new units coming to market in 2021. The last 10 years averaged 448 units per year.

The modest pace of new construction and population growth continues to pressure an already low vacancy rate. 520 new units are projected to come to market in 2022, located primarily in Burlington, Williston, South Burlington, and Essex/Essex Junction. Much more production is needed to significantly impact the challenging vacancy rate.

Luxury Home Market Results

custom luxury home for sale in Shelburne
274 South Pasture Road, Shelburne VT ~ Stunning custom home on 10 beautiful acres – total privacy and seclusion in the heart of Shelburne.
Northwest Vermont Luxury January-June 2022
Median Sale Price:Average Sale Price:Units Sold:Newly Listed:Days on Market:
$1,305,000 +7.9%$1,814,230 +26.9%39 +32.1%21 -40.0%55 -14.7%
Chittenden County Luxury January-June 2022
Median Sale Price:Average Sale Price:Units Sold:Newly Listed:Days on Market:
$1,305,000 +7.4%$1,875,484 +25.9%31 +26.1%15 -46.4%63 -12.5%

The luxury market reached historic levels throughout the pandemic as consumers with the means chose to add 2nd (or 3rd) homes to their portfolios, made their vacation homes their primary residences, and acted upon their dream of living in rural areas or locations aligned with their values. Vermont was one of the locations that often fulfilled those dreams.

The luxury market reached historic levels throughout the pandemic as consumers with the means chose to add 2nd (or 3rd) homes to their portfolios, made their vacation homes their primary residences, and acted upon their dream of living in rural areas or locations aligned with their values. Vermont was one of the locations that often fulfilled those dreams.
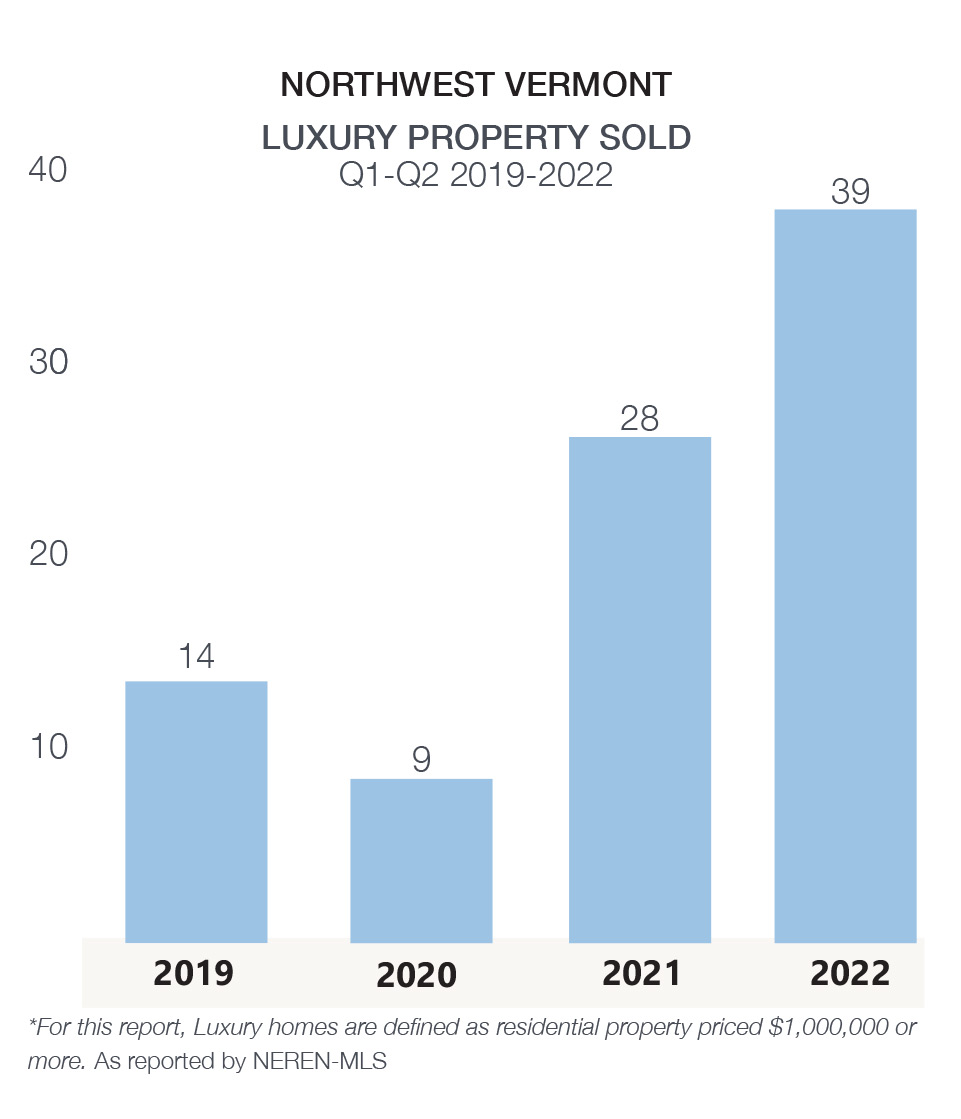
Northwest Vermont was not impacted as dramatically as the resort towns and southern Vermont; however, we did see significant demand. The first half of 2022 continued that trend as 39 properties sold at price points of over $1.0 million dollars – a 32.1% increase from 2021. Only 21 new properties came to market, a reduction of 40.0% from the prior year.

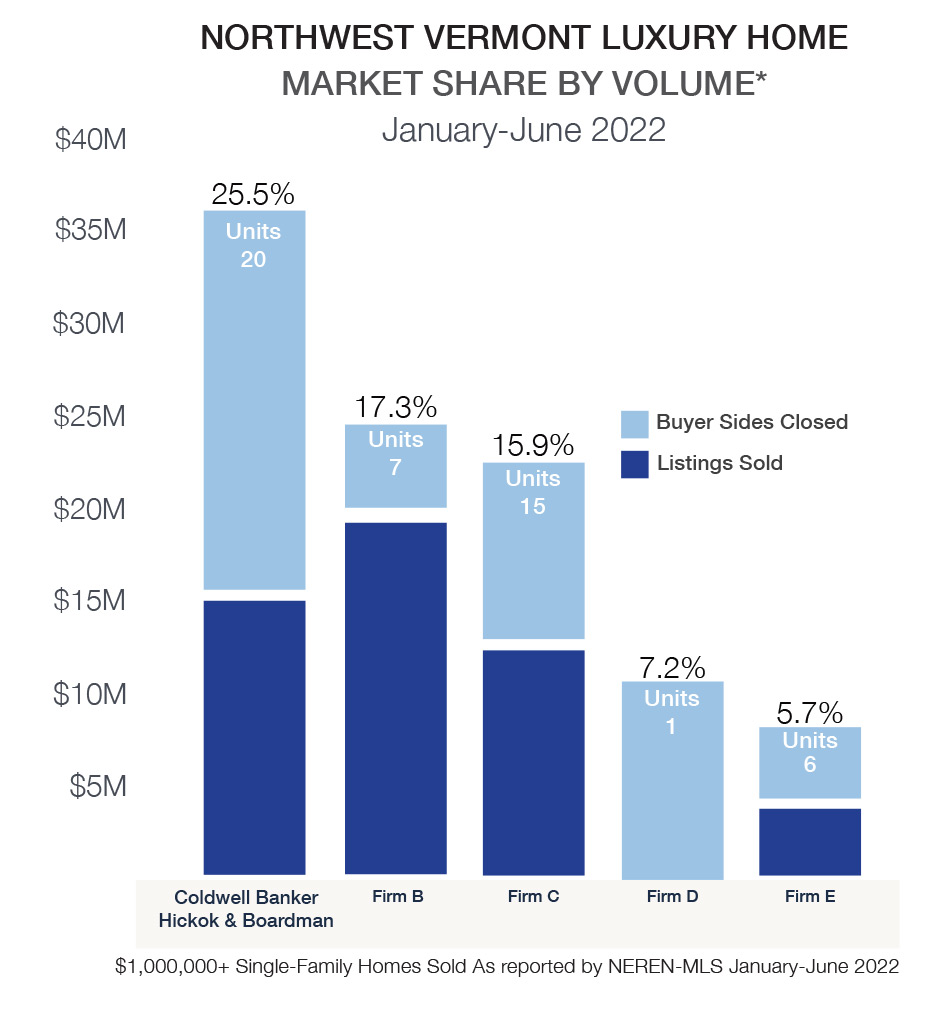
Slowing buyer demand and fewer available homes will likely cool this trend in late 2022. Before the pandemic, the luxury market was over-supplied with a three-year supply of homes for sale. Recent demand has reduced that to under 30 units, less than 12-18 months of supply in more typical market conditions. Although unique properties, well positioned and maintained, continue to move quickly, often with multiple offers. Our Agents are well versed through a dominant number of transactions to assist clients in navigating the luxury real estate market.

CountyTop townsUnits ClosedMedian Sale PriceAverage Sale PriceLowHigh
Addison County5$1,500,000 $1,603,000 $1,020,000 $2,300,000
Chittenden County31$1,305,000 $1,875,484 $1,000,000 $10,250,000
Burlington9$1,250,000 $1,339,444 --
Charlotte3$1,700,000 $3,054,333 --
Essex3$1,305,000 $1,235,000 --
Shelburne9$1,450,000 $2,658,333 --
Franklin County2$1,200,000 $1,200,000 $1,150,000 $1,250,000
Grand Isle County1$2,200,000 $2,200,000 $2,200,000 $2,200,000

Grand Isle County Market Results

To be built home for sale on Lake Champlain
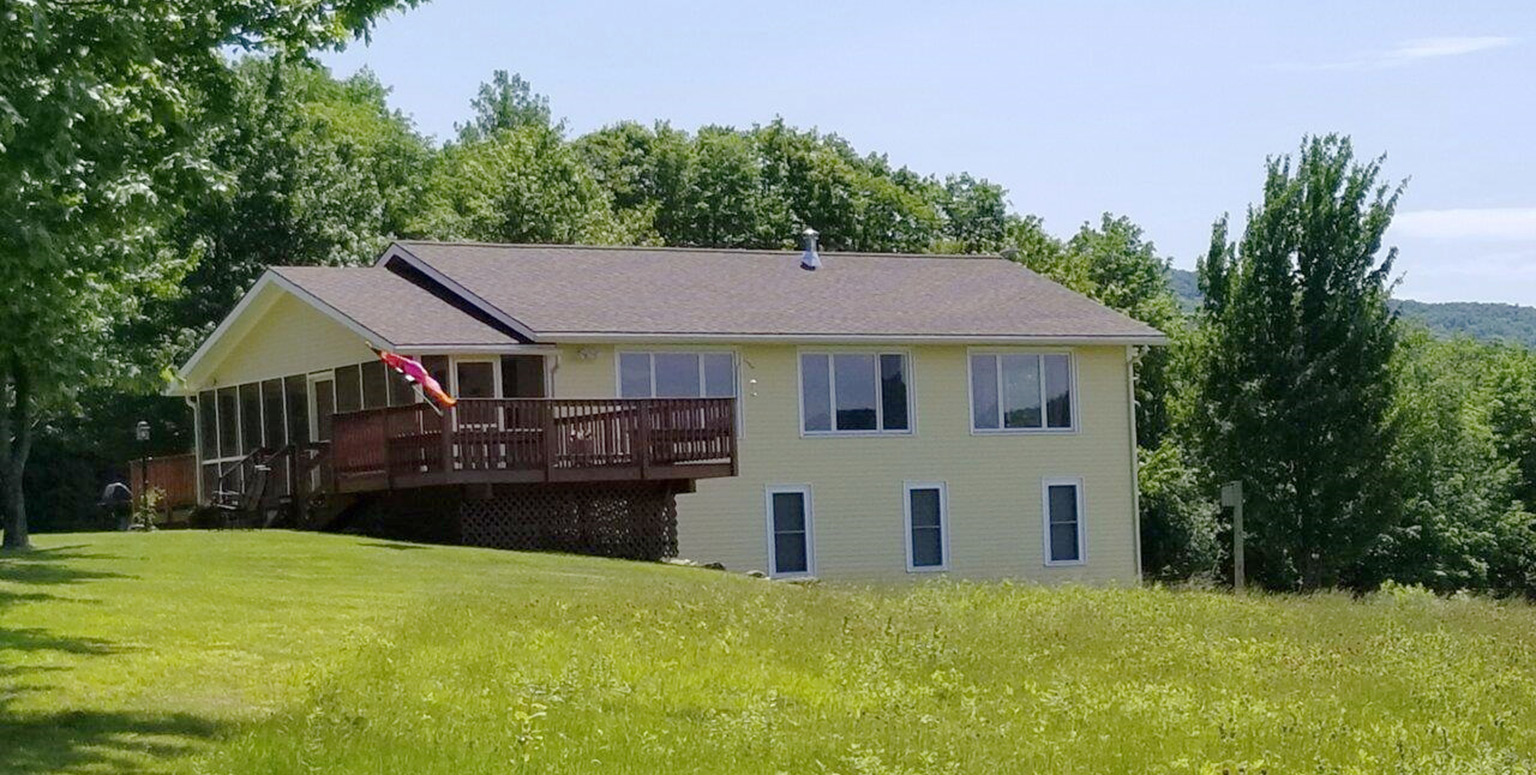
1 Terrapin Lane, Unit 1, Alburgh, VT ~ Join this new lakeshore community located on the shores of Lake Champlain, just minutes from Isle LaMotte, Rouse’s Point, NY and the Canadian border.
Single Family January-June 2022
Median Sale Price:Average Sale Price:Units Sold:Newly Listed:Days on Market:
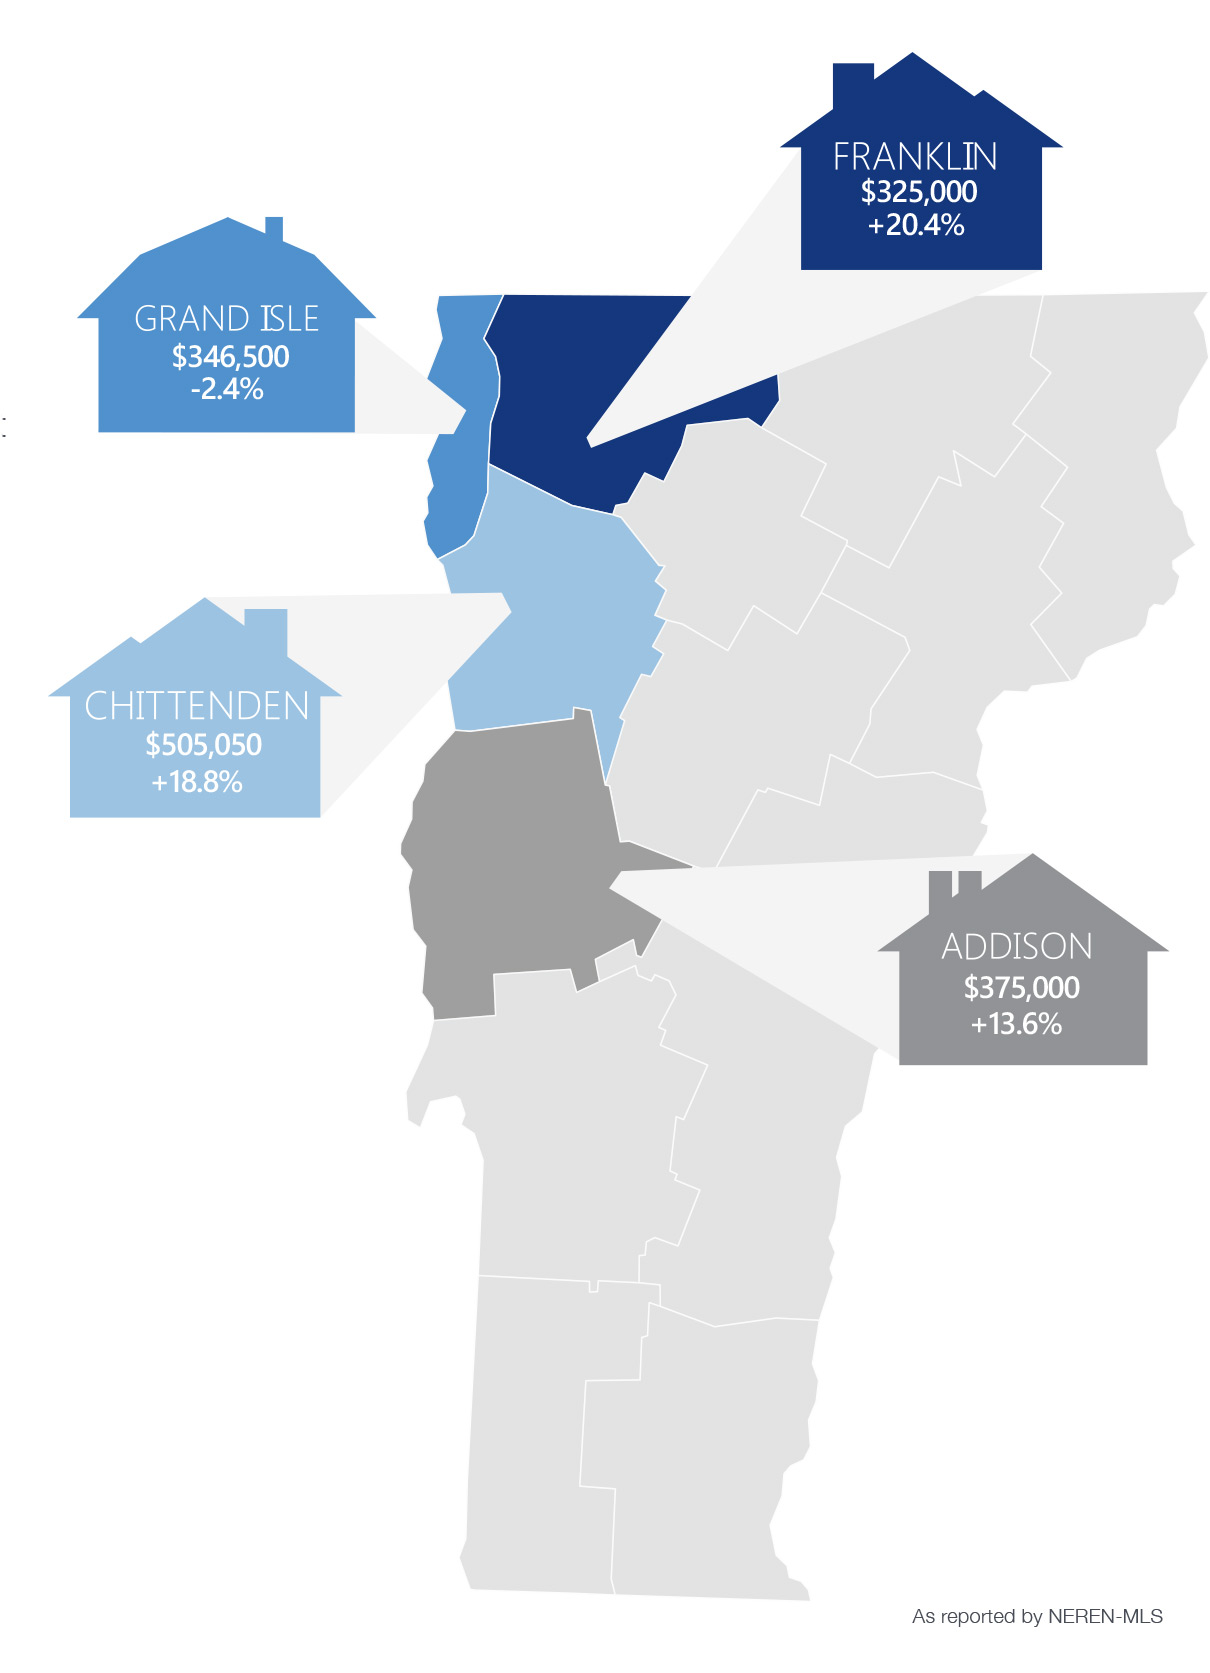
$346,500 -2.4% $419,411 +1.3%53 -30.3%84 -16.8%
51 -38.6%

Grand Isle County felt the impact of changing buying patterns throughout the pandemic when buyers were drawn to the beautiful landscape, lakefront property, and peaceful countryside. Some purchasers moved for retirement, others benefited from virtual employment, and some chose South Hero for its easy drive into Chittenden County.

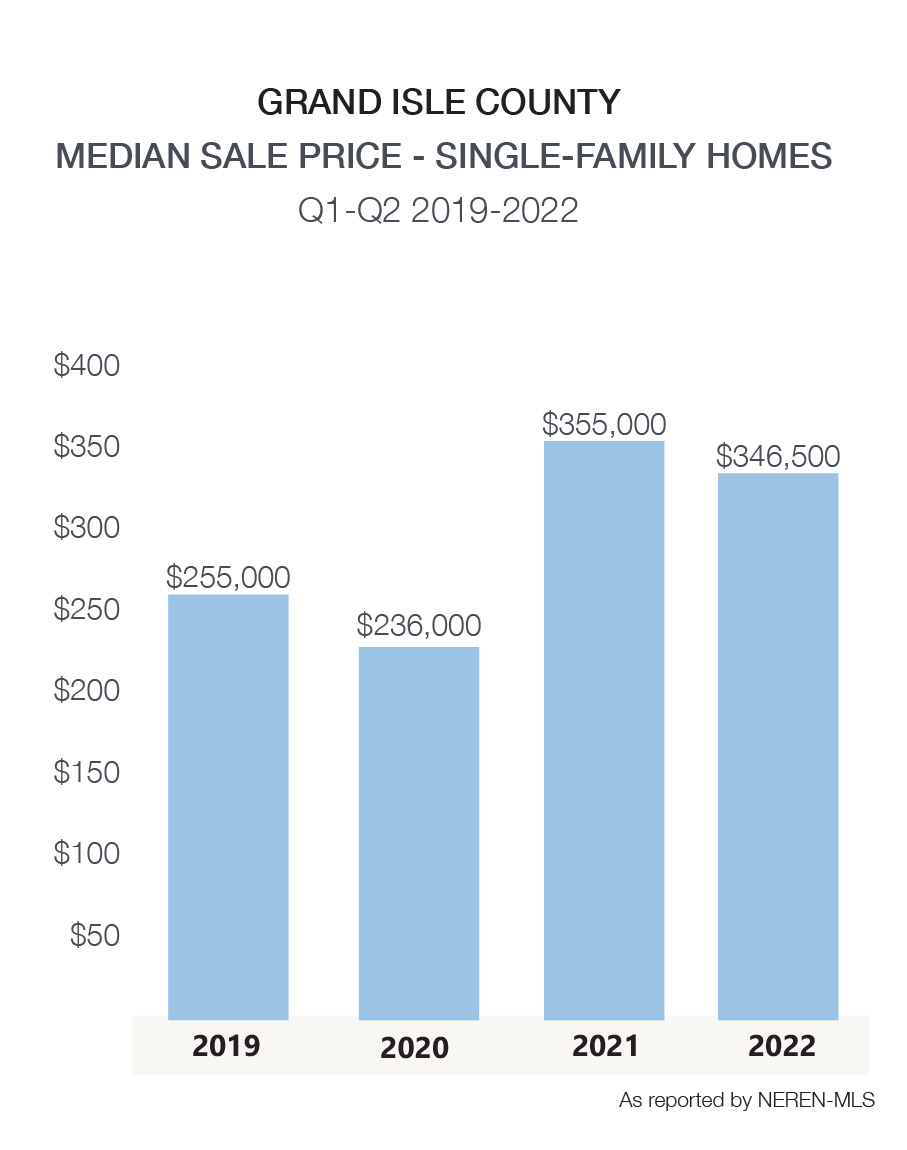
53 single-family homes sold in the first half of 2022, a 30% decline from the records set in 2021. 84 new properties came to market, still a 16% decline from the prior year. The median sale price at $346,500, a slight decrease from 2021, may reflect changing product mix vs. stalling price appreciation.   

MEDIAN SALE PRICEVS 2021UNITS SOLDVS 2021NEWLY LISTEDVS 2021DAYS ON MARKET
Grand Isle County Single-Family
$346,500 -2.4%$53-30.3%84-16.8%51
Alburgh
$259,000 4.7%$23-17.9%$27-20.6%77
Grand Isle
$410,000 32.9%$9-47.1%$17-15.0%22
Isle La Motte
$320,000 -28.7%50.0%1362.5%43
North Hero
$445,000 10.9%11-38.9%17-19.1%19
South Hero
$700,000 18.6%5-37.5%10-44.4%60

Franklin County Market Results

 Country home in Montgomery for sale

Single-Family January-June 2022
Median Sale Price:Average Sale Price:Units Sold:Newly Listed:Days on Market:
$325,000 +20.4% $345,443 +22.0%247 -13.3%332 -16.0%37 -26.0%
Condo January-December 2021
Median Sale Price:Average Sale Price:Units Sold:Newly Listed:Days on Market:
$254,000 +10.4% $321,318 +35.1%22 +4.8%22 +4.8%40 -42.9%

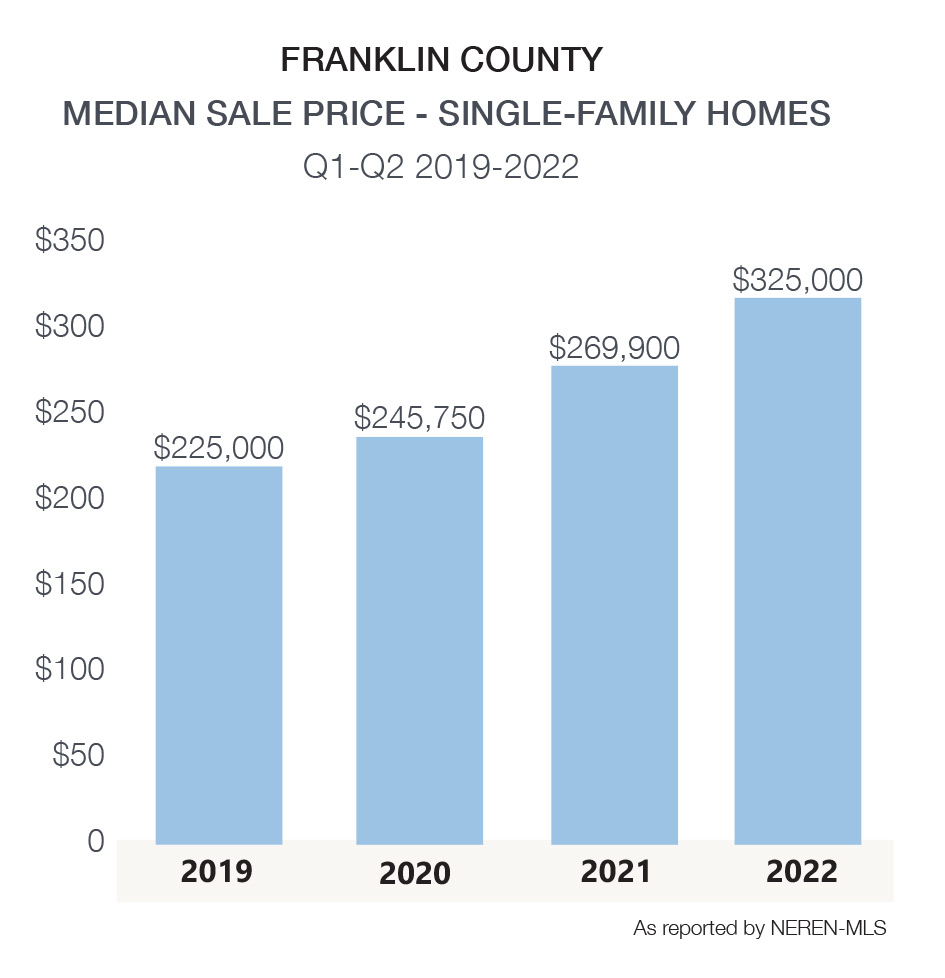
The Franklin County market trended similar to other counties in northwest Vermont in the first half of 2022, with a decline in new inventory resulting in a reduction in home purchases. However, buyer demand remained strong, as indicated by a sharp 26% decline in days on market (the number of days a property is listed until it closes) and an increase of +20% in the median sale price of single-family homes.

Franklin County is one of our most diverse counties, including active cities like St. Albans, lakeside communities, ski areas, and agricultural properties. The commute to Burlington and Chittenden County is relatively easy.

Franklin-County Median Sale Price Single-Family Homes

Franklin County Median Sale Price by Property Type

MEDIAN SALE PRICEVS 2021UNITS SOLDVS 2021NEWLY LISTEDVS 2021Average DAYS ON MARKET
Franklin County Single-Family
$325,000 20.4%$247-13.3%$332-16.0%37
Bakersfield
$281,000 21.3%$950.0%$6-45.5%70
Berkshire
$325,000 62.5%1042.9%10150.0%27
Enosburg
$235,000 45.1%13-18.8%21-16.0%13
Fairfax
$399,900 8.1%25-26.5%35-27.1%22
Fairfield
$425,000 43.2%3-50.0%4-63.6%49
Fletcher
$477,500 59.2%2-71.4%4-73.3%5
Franklin
$250,600 -19.2%80.0%18100.0%49
Georgia
$405,000 21.8%19-26.9%24-45.5%25
Highgate
$318,750 26.5%18100.0%2630.0%41
Montgomery
$379,900 104.0%1330.0%15-11.8%90
Richford
$227,500 69.8%8-61.9%180.0%78
Sheldon
$200,000 -30.2%5-61.5%9-47.1%15
St. Albans
$375,000 36.4%71-16.5%86-12.2%28
Swanton
$286,000 12.2%4316.2%56-3.5%41

Addison County Market Results

Year Round Lake Shore Cottage for Sale in Ferrisburgh
239 Shore Road Ferrisburgh, VT ~ Year-Round Lake Shore Cottage in the Long Point Community. The 3 bedroom, 1 bath cottage with dramatic cathedral ceilings & exposed beams, the open concept kitchen/living room is bright & spacious, with great mountain & lake views.
Single-Family January-June 2022
Median Sale Price:Average Sale Price:Units Sold:Newly Listed:Days on Market:
$375,000 +13.6% $431,529 +12.9%135 -30.8%191 -21.4%34 -60.0%
Condo January-June 2022
Median Sale Price:Average Sale Price:Units Sold:Newly Listed:Days on Market:
$302,001 +21.3% $314,817 +0.5%9 -40.0%6 -50.0%26 -46.9%

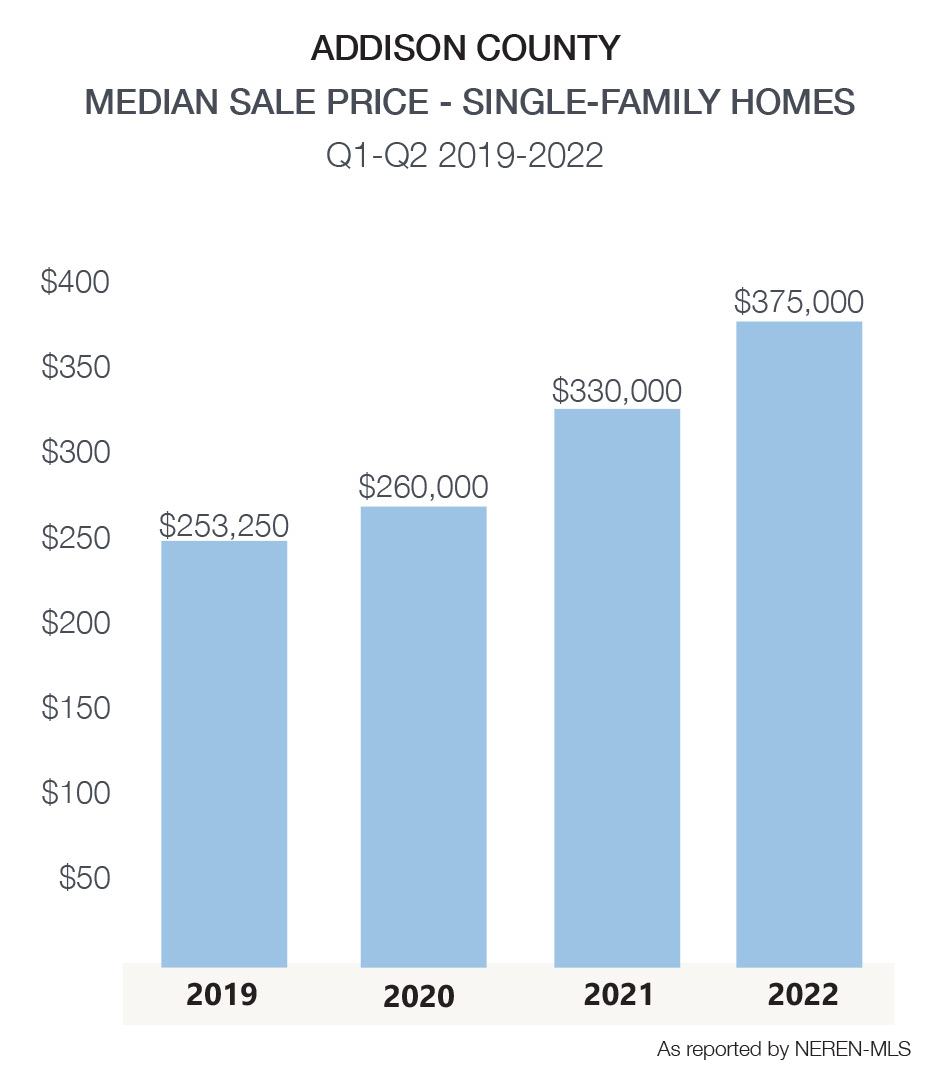
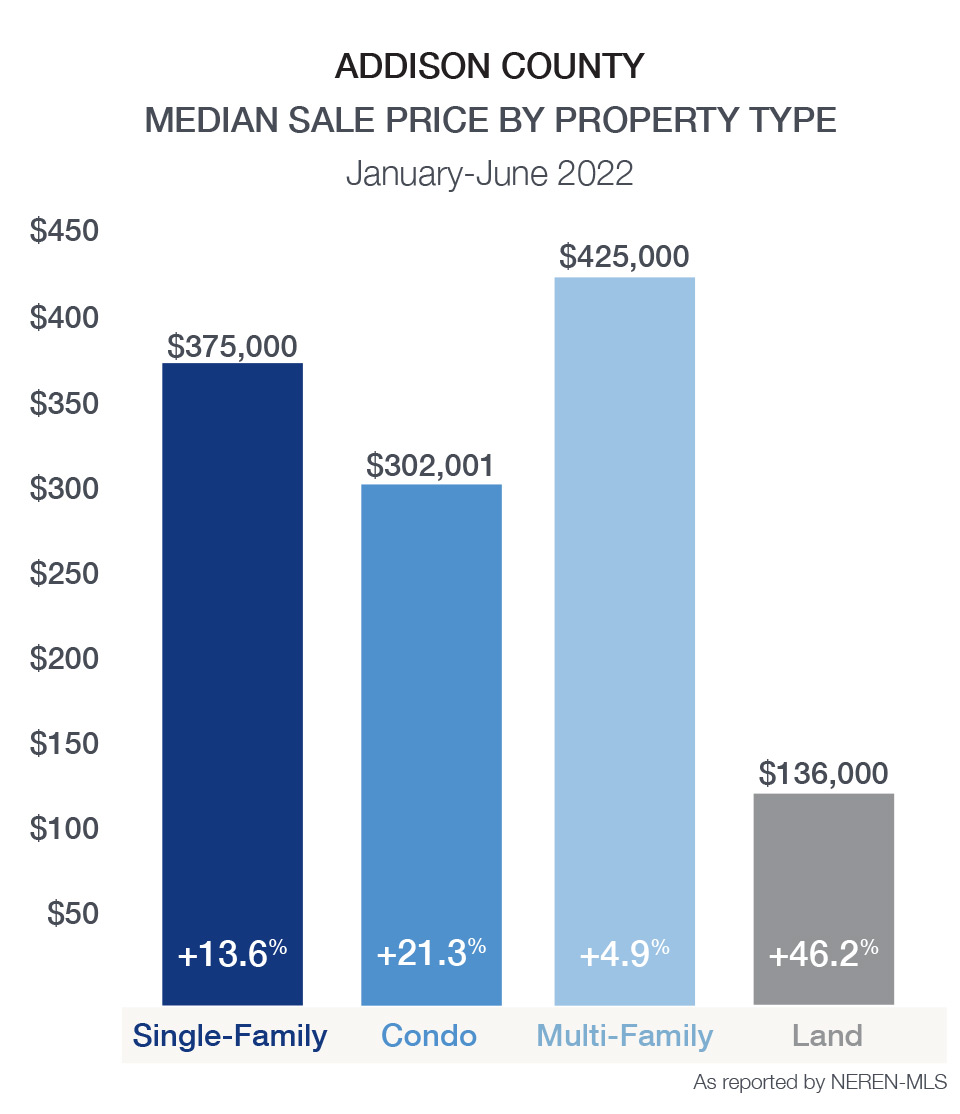
While Addison County felt a substantial downturn in sales throughout the first half of 2022, it’s important to note that 2021 represented historically high sales. Single family home sales declined 30% to 135 properties sold, and limited condominium units available limited transactions to 9, 40% less than in 2021. New inventory was soft, reflecting a 21.4% decline in single-family homes listed. Despite limited sales, prices appreciated by over 13.6%. Addison County was the beneficiary of interest from out-of-state buyers during the past two years as buyers sought more tranquil areas. The combination of charming towns like Vergennes, Bristol, and Middlebury surrounded by ample recreational, agricultural, and lakeshore property makes the region a desirable primary and second home market.

Addison County Median Sale Price Single-Family Homes

Addison County Median Sale Price by Property Type

MEDIAN SALE PRICEVS 2021UNITS SOLDVS 2021NEWLY LISTEDVS 2021Average DAYS ON MARKET
Addison County Single-Family$375,000 13.6%$135-30.8%$191-21.4%34
Addison
$495,000 -39.8%716.7%1233.3%27
Bridport
$339,500 42.5%6-40.0%6-45.5%14
Bristol
$352,500 13.7%14-26.3%180.0%22
Cornwall
$550,000 4.4%1-87.5%70.0%6
Ferrisburgh
$493,500 45.4%14-22.2%1721.4%19
Goshen
$369,750 73.7%2-33.3%20.0%106
Granville
$338,750 125.8%2-33.3%1-83.3%100
Hancock
$262,500 118.8%20.0%2-33.3%6
Leicester
$240,000 -15.3%4-50.0%12-14.3%5
Lincoln
$417,500 54.6%50.0%80.0%107
Middlebury
$372,500 -12.2%20-23.1%30-21.1%26
Monkton
$409,000 -2.6%9-30.8%140.0%52
New Haven
$455,000 -4.2%5-37.5%6-57.1%5
Orwell
$451,250 37.7%6-40.0%8-46.7%58
Panton
$310,000 -25.0%525.0%860.0%14
Ripton
-0.0%-0.0%1-75.0%-
Salisbury
$303,500 10.4%6-33.3%5-37.5%27
Shoreham
$447,000 33.4%2-66.7%3-70.0%37
Starksboro
$249,000 -7.8%6-14.3%5-44.4%60
Vergennes
$345,000 34.0%11-8.3%14-26.3%28
Waltham
-0.0%-0.0%1-66.7%-
Weybridge
$375,000 -10.9%4-50.0%8-20.0%10
Whiting
$324,500 62.3%433.3%350.0%111

Chittenden County Market Results

Charlotte home for sale with tennis court
517 Greenbush Road, Charlotte, VT ~ Amazing property on 5 country acres! Over 3,700 sq. ft. on 3 levels. Large kitchen with island and shiny, black granite countertops, stainless steel appliances, and so many cabinets for storage!
Single-Family January-June 2022
Median Sale Price:Average Sale Price:Units Sold:Newly Listed:Days on Market:
$505,050 +18.8%
$608,421 +21.4%
484 -9.7%
659 -15.4%
19 -38.7%
Condo January-June 2022
Median Sale Price:Average Sale Price:Units Sold:Newly Listed:Days on Market:
$340,000 +21.9% $385,790 +21.7%
313 +12.2%376 -1.3%22 -35.3%

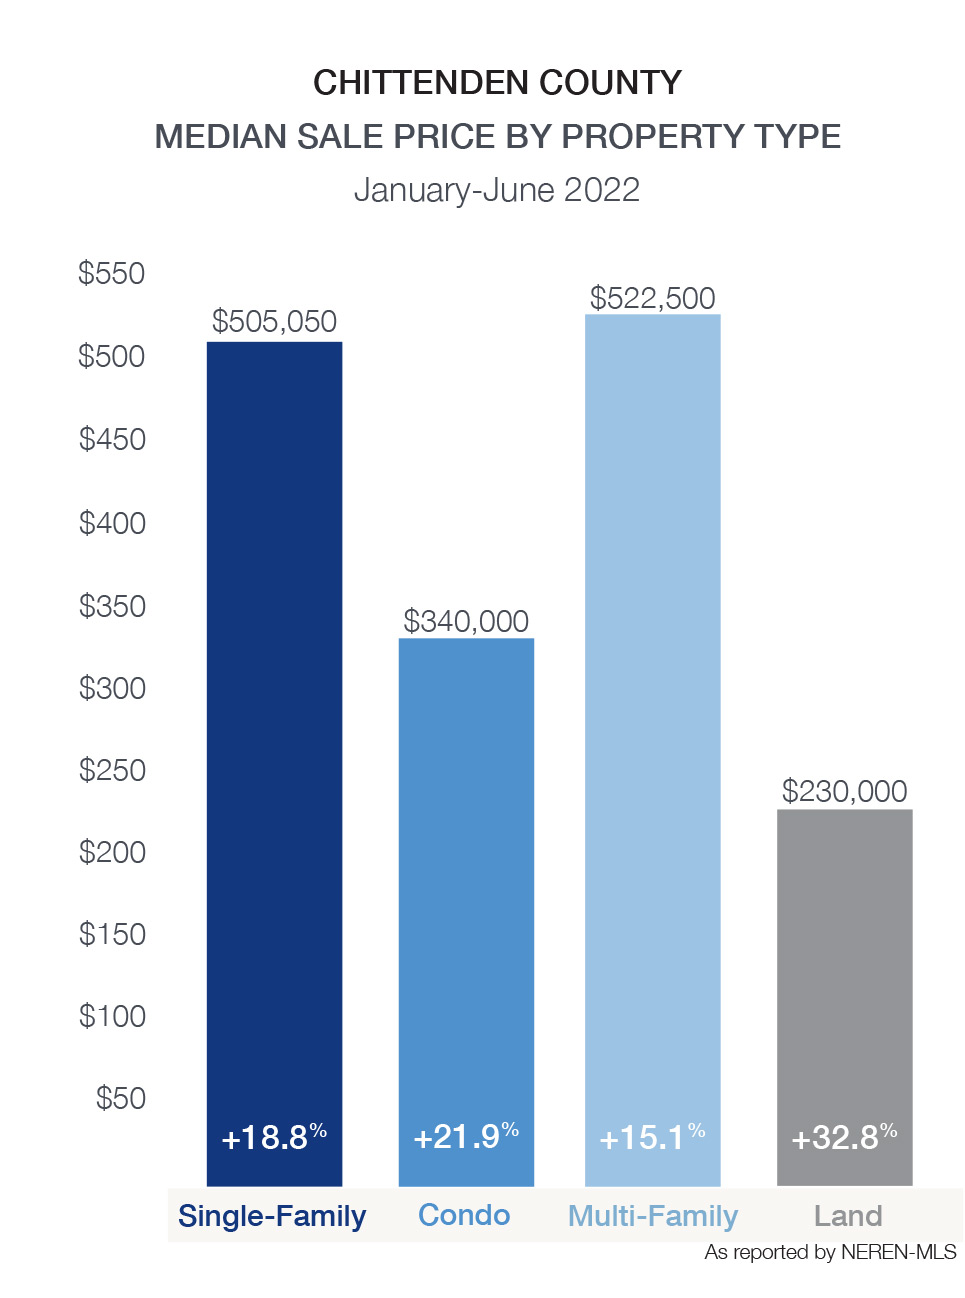
Both single-family homes and condos showed substantial price appreciation in Chittenden County. The median sale price of single-family homes rose to $505,050 – a record high. Newly listed properties dropped 15.4% to 559. Pending single-family homes in May, an indicator of home sales to come, were flat with last year and showed a 10.2% decline over a 12-month average. Limited choice and slowing buyer demand are two contributing factors to this decline.

While condominium options are slightly more plentiful in Chittenden County, new inventory was down 1.3% from 2021 with 376 new listings. Limited inventory continued to put pressure on prices as the median sale price of condominiums appreciated to $340,000, a nearly 22% increase over last year. Higher interest rates, coupled with inflation are slowing cooling demand. It is anticipated that inventory will gradually increase, slowing down price appreciation.

MEDIAN SALE PRICEVS 2021UNITS SOLDVS 2021NEWLY LISTEDVS 2021Average DAYS ON MARKET
Chittenden County Single-Family
$505,050 19.0%484-10.0%659-15.0%19
Bolton
$700,000 150.0%1-50.0%30.0%4
Burlington
$550,000 22.2%821.2%121-2.4%19
Charlotte
$767,500 21.8%16-5.9%22-24.1%14
Colchester
$498,500 13.9%46-14.8%55-34.5%21
Essex
$447,700 24.4%835.1%89-18.4%22
Hinesburg
$630,000 38.2%1721.4%3461.9%9
Huntington
$350,000 -9.6%11120.0%1587.5%30
Jericho
$630,000 30.5%13-40.9%21-38.2%15
Milton
$407,000 16.3%31-32.6%41-45.3%18
Richmond
$453,600 -10.2%980.0%9-43.8%8
Shelburne
$804,000 21.8%35-28.6%55-1.8%25
South Burlington
$532,500 4.5%59-28.1%87-21.6%22
St. George
$455,000 -17.7%1-85.7%6-14.3%5
Underhill
$597,500 67.1%833.3%1110.0%14
Westford
$423,000 18.5%8-27.3%11-21.4%11
Williston
$605,355 27.5%4418.9%6224.0%20
Winooski
$391,250 20.8%205.3%17-39.3%9
MEDIAN SALE PRICEVS 2021UNITS SOLDVS 2021NEWLY LISTEDVS 2021Average DAYS ON MARKET
Chittenden County Condo$340,000 22.00%31312.00%376-1.00%22
Bolton$293,600 73.70%4-20.00%40.00%5
Burlington$395,000 41.10%5422.70%8144.60%14
Colchester$340,000 30.80%375.70%40-4.80%12
Essex$320,000 43.20%56-3.50%68-5.60%13
Hinesburg$422,500 30.90%60.00%833.30%6
Jericho$253,000 -50.70%1-66.70%1-75.00%4
Milton$270,000 11.60%9-18.20%1946.20%28
Richmond$350,000 18.00%1-50.00%10.00%5
Shelburne$390,000 1.30%7-36.40%7-46.20%5
South Burlington$330,000 6.60%9332.90%99-20.20%40
Williston$400,000 8.40%3552.20%3742.30%11
Winooski$332,500 15.90%1011.10%11-31.30%54