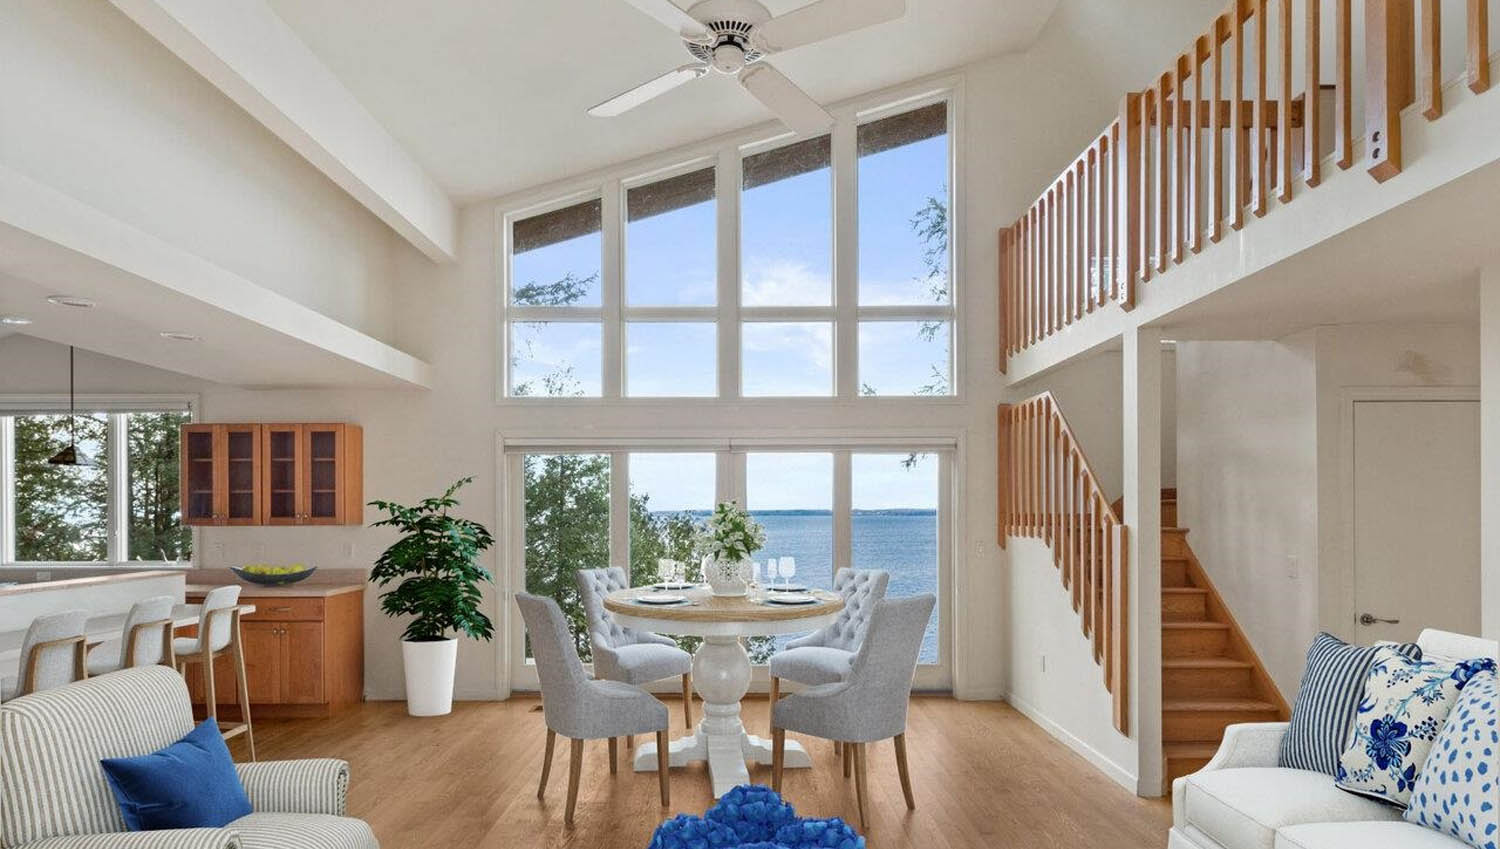
Nestled in the woods above Lake Champlain, this beautiful Contemporary enjoys stunning views. Beach easement and first floor primary suite. Colchester
| Single-Family Q1 2023 | |||
|---|---|---|---|
| New Listings | Units Sold | Median Sold Price | Days on Market |
| 183 (-24%) | 160 (-7.51%) | $508K (+14%) | 11 (+83%) |
| Condos Q1 2023 | |||
|---|---|---|---|
| New Listings | Units Sold | Median Sold Price | Days on Market |
| 121 (-6.2%) | 77 (-32%) | $351K (+9.14%) | 5 (+0%) |
In Chittenden County, one of the most populous areas in northwest Vermont, the first quarter of 2023 saw a slight decrease in closed sales for single-family homes, with a decline of around 7.5% compared to the same period last year. This is due to the shortage of available inventory, as the number of new listings for single-family homes in the county dropped by approximately 24% year-over-year. This lack of inventory has led to increased competition among buyers, leading to higher prices for available properties. Despite these challenges, the real estate market in Chittenden County remains strong, with many buyers still looking to purchase homes in this desirable area. The demand for homes in good condition, priced in the $450,000 – $650,000 range seem to be the sweet spot, although most price points are moving quickly. Despite interest rates being significantly higher than the same time last year, we are predicting increased activity in the coming months.
- Chittenden County’s single-family home sales decreased by approximately 7.5% in the first quarter of 2023, compared to the same period last year.
- However, the median price for single-family homes in the county increased by around 14.4% year-over-year, indicating continued strong demand despite the lower sales volume.
- The number of new listings for single-family homes in Chittenden County dropped by approximately 24% compared to the first quarter of 2022, contributing to the limited inventory.
- The condo market in Chittenden County also saw a decline in sales volume, with a drop of around 32% compared to the same period last year. However, the median price for condos increased by around 9%, indicating that demand remains strong in this segment of the market.
- In Milton, a town located in Chittenden County, closed sales of single-family homes increased by an impressive 56% compared to the first quarter of 2022, outpacing the county-wide trend.
| NEW LISTINGS | VS 2022 | UNITS SOLD | VS 2022 | MEDIAN SOLD PRICE | VS 2022 | MEDIAN DOM |
|
|---|---|---|---|---|---|---|---|
| Bolton | 4 | 100% | 1 | 0.00% | $850 K | 156% | 70 |
| Single Family | 2 | 1 | $850 K | 70 | |||
| Condo | 2 | 0.00% | 0 | $0 | 0 | ||
| Burlington | 46 | -28% | 45 | -10% | $375 K | -5.06% | 28 |
| Single Family | 26 | -30% | 27 | 8.00% | $502 K | 22% | 48 |
| Condo | 20 | -26% | 18 | -28% | $355 K | 6.77% | 6 |
| Charlotte | 5 | -17% | 2 | -71% | $685 K | -31% | 4 |
| Single Family | 5 | -17% | 2 | -71% | $685 K | -31% | 4 |
| Condo | 0 | 0 | $0 | 0 | |||
| Colchester | 26 | -16% | 18 | -44% | $443 K | 0.68% | 10 |
| Single Family | 17 | -11% | 10 | -50% | $443 K | 0.11% | 7 |
| Condo | 9 | -25% | 8 | -33% | $440 K | 11% | 18 |
| Essex | 26 | -51% | 15 | -58% | $410 K | 7.61% | 10 |
| Single Family | 13 | -55% | 10 | -52% | $622 K | 45% | 25 |
| Condo | 13 | -46% | 5 | -67% | $350 K | 11% | 0 |
| Essex Junction | 19 | 18 | $403 K | 18 | |||
| Single Family | 14 | 16 | $420 K | 18 | |||
| Condo | 5 | 2 | $335 K | 20 | |||
| Hinesburg | 2 | -86% | 1 | -75% | $542 K | 13% | 11 |
| Single Family | 2 | -80% | 1 | -67% | $542 K | -23% | 11 |
| Condo | 0 | 0 | $0 | 0 | |||
| Huntington | 1 | -75% | 1 | -67% | $139 K | 8.59% | 40 |
| Single Family | 1 | -75% | 1 | -67% | $139 K | 8.59% | 40 |
| Condo | 0 | 0 | $0 | 0 | |||
| Jericho | 8 | 33% | 3 | -57% | $445 K | -3.26% | 7 |
| Single Family | 4 | -33% | 3 | -50% | $445 K | -20% | 7 |
| Condo | 4 | 0 | $0 | 0 | |||
| Milton | 28 | 56% | 26 | 136% | $424 K | 4.57% | 6 |
| Single Family | 23 | 44% | 24 | 167% | $425 K | -2.30% | 6 |
| Condo | 5 | 150% | 2 | 0.00% | $310 K | 36% | 6 |
| Richmond | 3 | 50% | 2 | -50% | $1.15 M | 208% | 15 |
| Single Family | 3 | 50% | 2 | -50% | $1.15 M | 208% | 15 |
| Condo | 0 | 0 | $0 | 0 | |||
| Shelburne | 11 | -39% | 12 | -37% | $710 K | 10% | 6 |
| Single Family | 6 | -65% | 7 | -53% | $645 K | -16% | 7 |
| Condo | 5 | 400% | 5 | 25% | $776 K | 114% | 4 |
| South Burlington | 72 | -6.49% | 52 | -8.77% | $489 K | 36% | 5 |
| Single Family | 38 | -9.52% | 24 | 4.35% | $602 K | 33% | 5 |
| Condo | 34 | -2.86% | 28 | -18% | $320 K | -2.14% | 5 |
| St. George | 2 | -33% | 4 | $675 K | 20 | ||
| Single Family | 2 | -33% | 4 | $675 K | 20 | ||
| Condo | 0 | 0 | $0 | 0 | |||
| Underhill | 6 | 0.00% | 4 | -20% | $421 K | -30% | 21 |
| Single Family | 6 | 0.00% | 4 | -20% | $421 K | -30% | 21 |
| Condo | 0 | 0 | $0 | 0 | |||
| Westford | 2 | -67% | 4 | 33% | $543 K | 29% | 10 |
| Single Family | 2 | -67% | 4 | 33% | $543 K | 29% | 10 |
| Condo | 0 | 0 | $0 | 0 | |||
| Williston | 29 | -33% | 21 | -30% | $485 K | 8.23% | 6 |
| Single Family | 12 | -56% | 16 | -11% | $653 K | 17% | 12 |
| Condo | 17 | 6.25% | 5 | -58% | $306 K | -5.85% | 5 |
| Winooski | 14 | 7.69% | 8 | -27% | $353 K | -13% | 4 |
| Single Family | 7 | -22% | 4 | -43% | $365 K | -11% | 3 |
| Condo | 7 | 75% | 4 | 0.00% | $325 K | 3.42% | 5 |
| Total | 304 | -18% | 237 | -17% | $435 K | 5.84% | 8 |
| Single Family | 183 | -24% | 160 | -7.51% | $508 K | 14% | 11 |
| Condo | 121 | -6.20% | 77 | -32% | $351 K | 9.14% | 5 |
