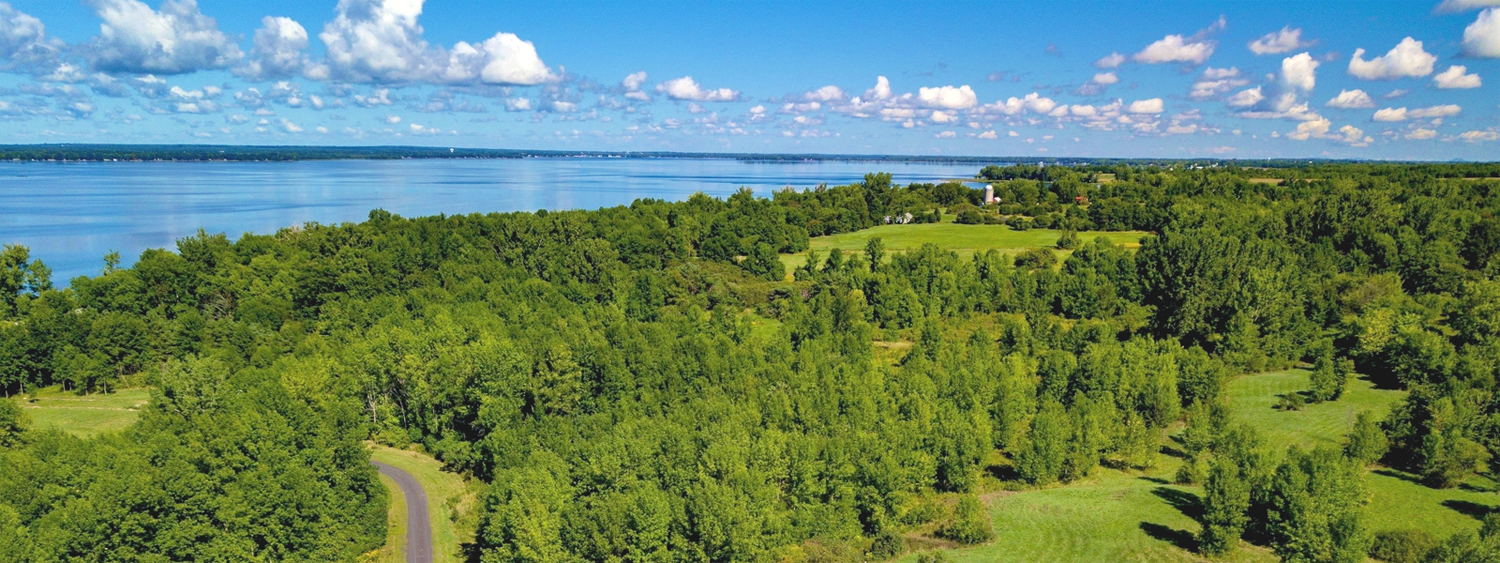
Two lots remain on Terrapin Lane, an eleven lot lakeshore community. Nestled between Lake Champlain and the rolling fairways and greens of the Alburgh Golf Links.
| Single-Family Q1 2023 | |||
|---|---|---|---|
| New Listings | Units Sold | Median Sold Price | Days on Market |
| 21 (-22%) | 10 (-57%) | $370K (+12%) | 8 (-82%) |
The Grand Isle real estate market saw a significant decline of approximately 56.5% in new listings for all types of homes in the first quarter of 2023, compared to the same period last year. This limited the inventory available for buyers and contributed to an overall decline in sales volume.
Despite the limited inventory, the median sales price for all types of homes in Grand Isle increased by approximately 12.0% year-over-year, indicating continued strong demand in this segment of the market.
The Grand Isle real estate market also saw a decline in days on the market for all types of homes, with the average number of days on market dropping to just 19 days in the first quarter of 2023. This suggests that homes are selling quickly in this area, potentially due to the high demand and limited inventory
This outcome may primarily reflect the seasonality, as Grand Isle County’s real estate market is heavily influenced by sales of lakefront properties. Notably, the county did not disclose any condominium sales during the period of January through March
| NEW LISTINGS | VS 2022 | UNITS SOLD | VS 2022 | MEDIAN SALE PRICE | VS 2022 | MEDIAN DOM | |
|---|---|---|---|---|---|---|---|
| Alburgh | 9 | 10 | 6 | 12 | $340 K | $230 K | 17 |
| Grand Isle | 3 | 6 | 1 | 4 | $505 K | $403 K | 3 |
| Isle La Motte | 2 | 5 | 1 | 3 | $735 K | $435 K | 53 |
| North Hero | 3 | 3 | 2 | 3 | $328 K | $347 K | 3 |
| Total | 21 | 27 | 10 | 23 | $370 K | $330 K | 8 |
