| Single-Family January-June 2023 | ||||
|---|---|---|---|---|
| Median Sale Price: | Average Sale Price: | Units Sold: | Newly Listed: | Days on Market: |
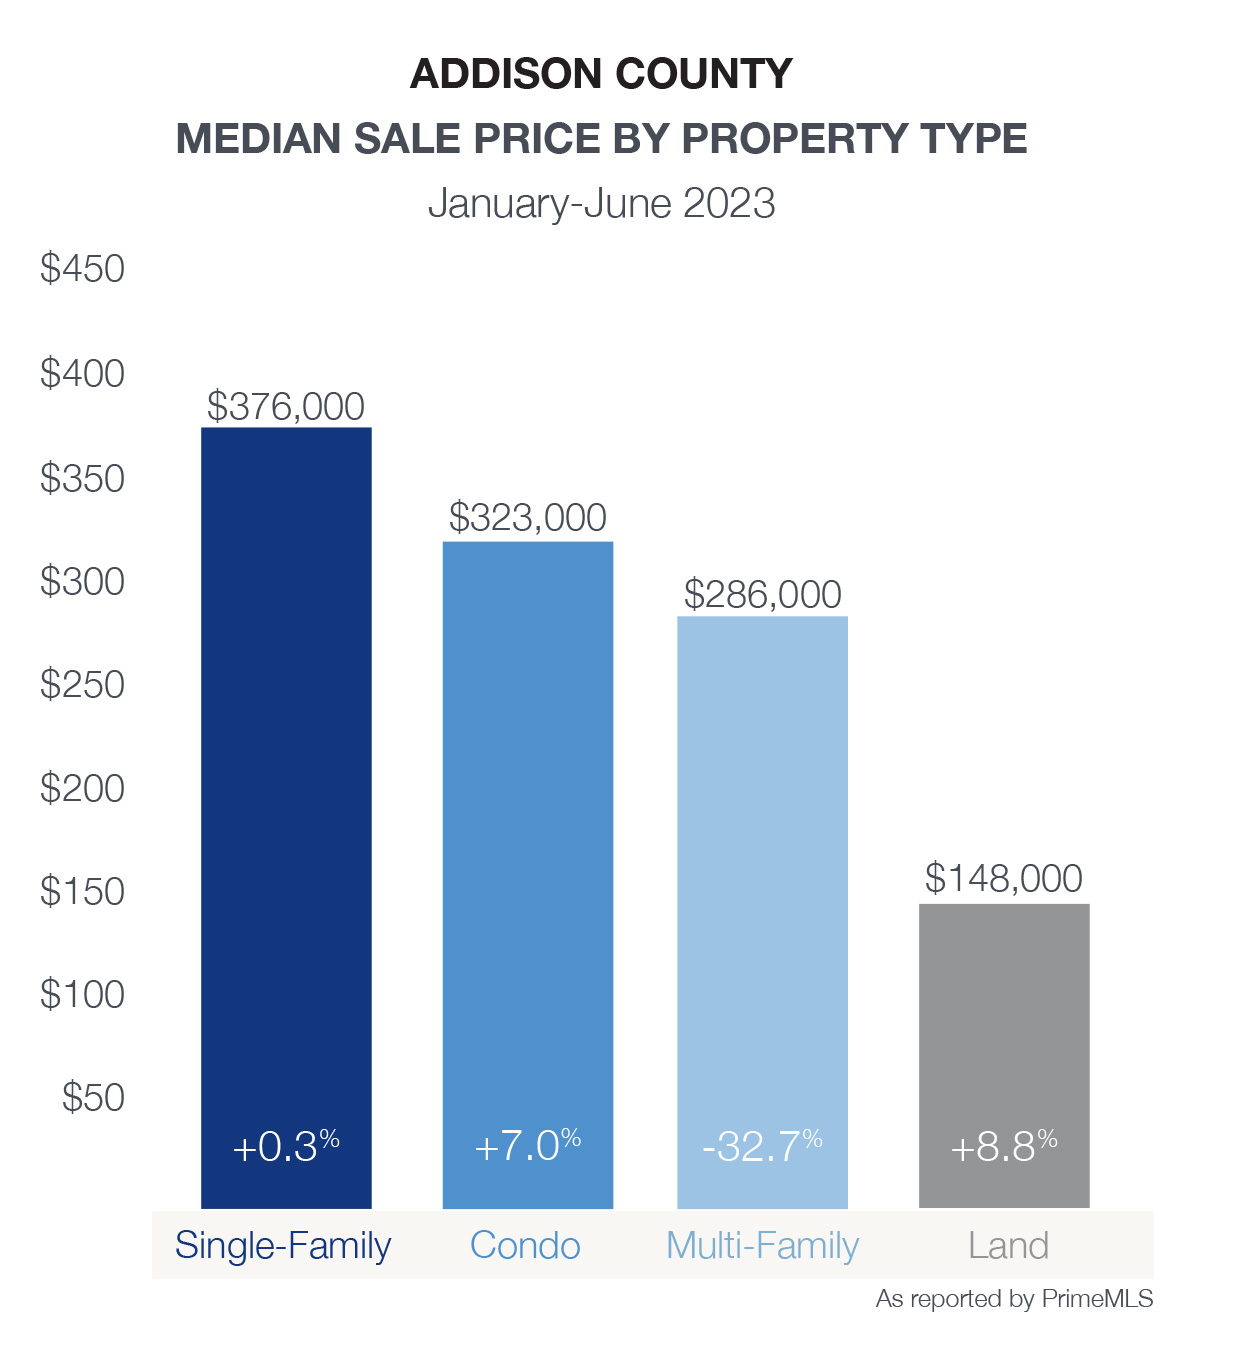
| $376,000 +0.3 % | $467,149 +8.3 % | 121 -10.4 % | 170 -11.0 % | 36 +5.9% |
| Condos January-June 2023 | ||||
|---|---|---|---|---|
| Median Sale Price: | Average Sale Price: | Units Sold: | Newly Listed: | Days on Market: |
| $323,000 +7.0% | $381,438 +21.2% | 8 -11.1% | 8 +33.3% | 14 -46.2% |
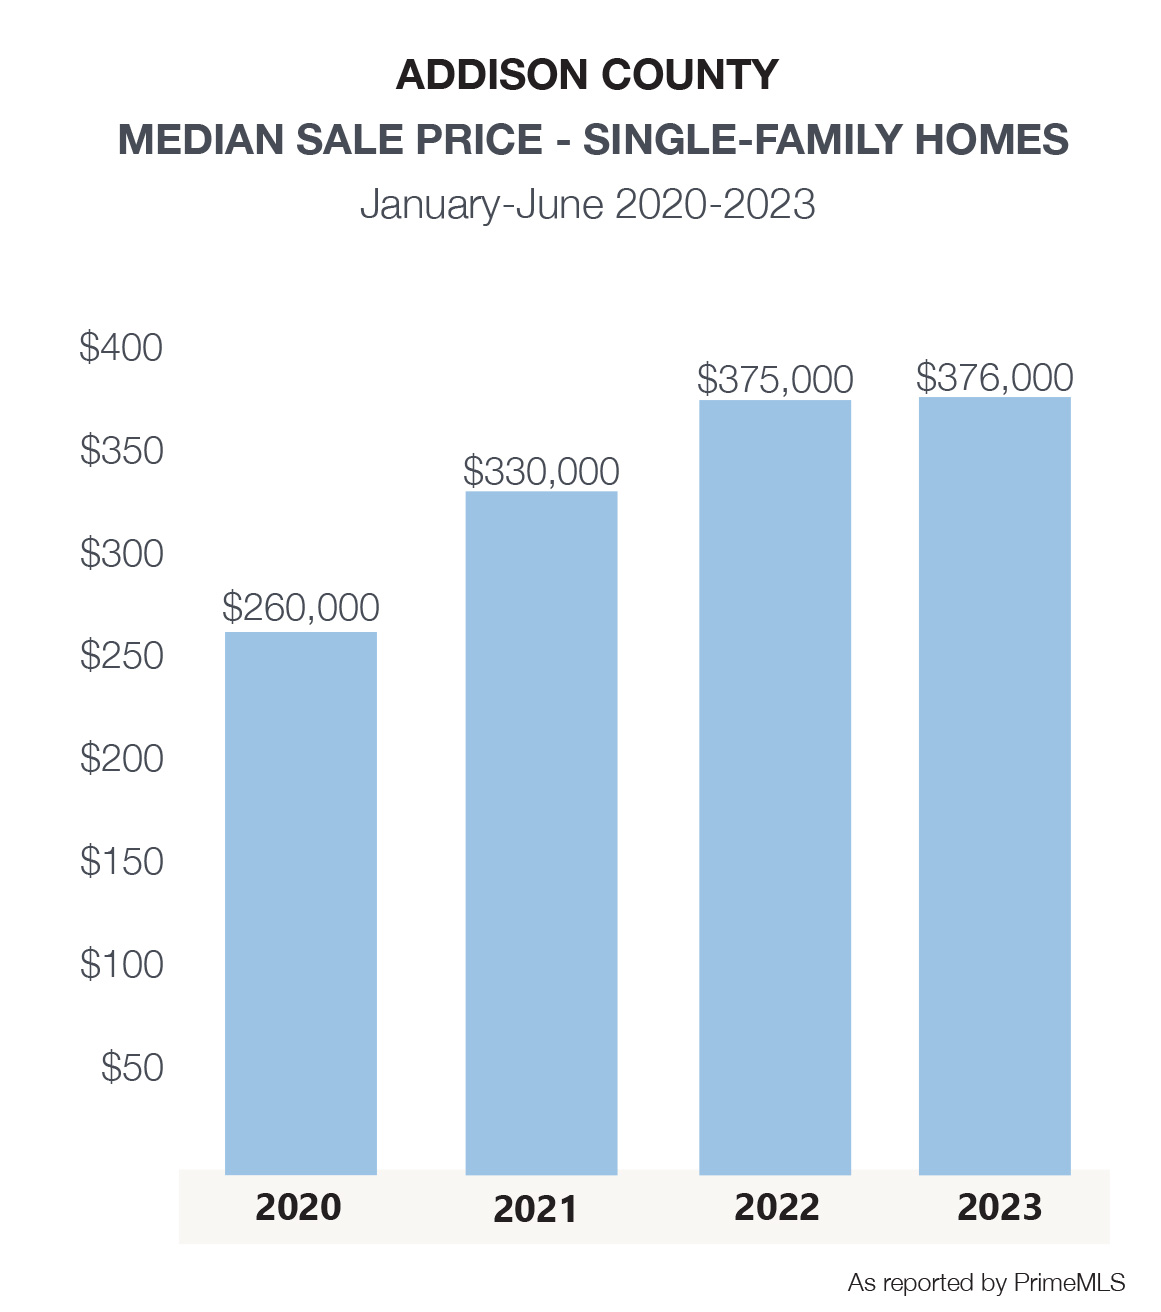
The real estate market in Addison County is not immune to the trends seen across other counties in this report although at a more moderate pace. The number of single-family homes sales declined by only 12 units, while the number of new listings on the market dropped by 17 units. With a small number of transactions in many towns, the data can show dramatic swings in one direction or the other.
Bristol, Ferrisburgh, Middlebury, Monkton, Orwell, and Vergennes proved the most popular with the greatest number of sales, however with far fewer new listings as compared to last year at this time. Ferrisburgh, in the northern part of the county, posted a median sale price of $529,000 – significantly higher than the county average of $376,000.
While there are few condominium sales in the county, the available parcels of land for sale increased by 21% during the first half. This resulted in 30 closed sales, the highest number of land sales in the region.


| MEDIAN SALE PRICE | VS 2022 | UNITS SOLD | VS 2022 | NEWLY LISTED | VS 2022 | DAYS ON MARKET | |
|---|---|---|---|---|---|---|---|
| Addison County Single-Family | $376,000 | 0.3% | 121 | 57.1% | 170 | -11.0% | 36 |
| Addison | $529,000 | 6.9% | 3 | 0.0% | 7 | -41.7% | 82 |
| Bridport | $253,260 | -25.4% | 6 | -14.3% | 13 | 116.7% | 16 |
| Bristol | $366,250 | 3.9% | 12 | 40.0% | 14 | -22.2% | 15 |
| Cornwall | $525,000 | -4.6% | 5 | -28.6% | 8 | 14.3% | 77 |
| Ferrisburgh | $529,000 | 7.2% | 10 | n/a | 16 | -5.9% | 27 |
| Goshen | n/a | 0.0% | n/a | 0.0% | 1 | -50.0% | n/a |
| Granville | $411,000 | 21.3% | 2 | -50.0% | 3 | 200.0% | 82 |
| Hancock | $376,000 | 43.2% | 1 | 0.0% | 5 | 150.0% | 10 |
| Leicester | $444,000 | 85.0% | 4 | -60.0% | 3 | -75.0% | 120 |
| Lincoln | $666,250 | 59.6% | 2 | -20.0% | 2 | -75.0% | 45 |
| Middlebury | $367,500 | -1.3% | 16 | 0.0% | 20 | -33.3% | 22 |
| Monkton | $385,000 | -5.9% | 9 | 0.0% | 12 | -14.3% | 4 |
| New Haven | $485,000 | 6.6% | 5 | 66.7% | 5 | -16.7% | 17 |
| Orwell | $299,500 | -33.6% | 10 | -8000.0% | 11 | 37.5% | 46 |
| Panton | $335,000 | 8.1% | 1 | 0.0% | 3 | -62.5% | 3 |
| Ripton | $450,510 | 0.0% | 3 | -50.0% | 3 | 200.0% | 188 |
| Salisbury | $275,000 | -9.4% | 3 | 150.0% | 9 | 80.0% | 34 |
| Shoreham | $415,000 | -7.20% | 5 | 0.0% | 6 | 100.00% | 42 |
| Starksboro | $227,500 | -8.60% | 6 | 0.0% | 8 | 60.00% | 39 |
| Vergennes | $350,000 | 1.50% | 11 | 0.0% | 12 | -14.30% | 26 |
| Waltham | $499,500 | 0.00% | 2 | 25 | 3 | 200.00% | 6 |
| Weybridge | $502,000 | 33.90% | 5 | n/a | 6 | -25.00% | 11 |
| Whiting | n/a | n/a | n/a | n/a | n/a | n/a | n/a |
