| Single-Family January-June 2023 | ||||
|---|---|---|---|---|
| Median Sale Price: | Average Sale Price: | Units Sold: | Newly Listed: | Days on Market: |
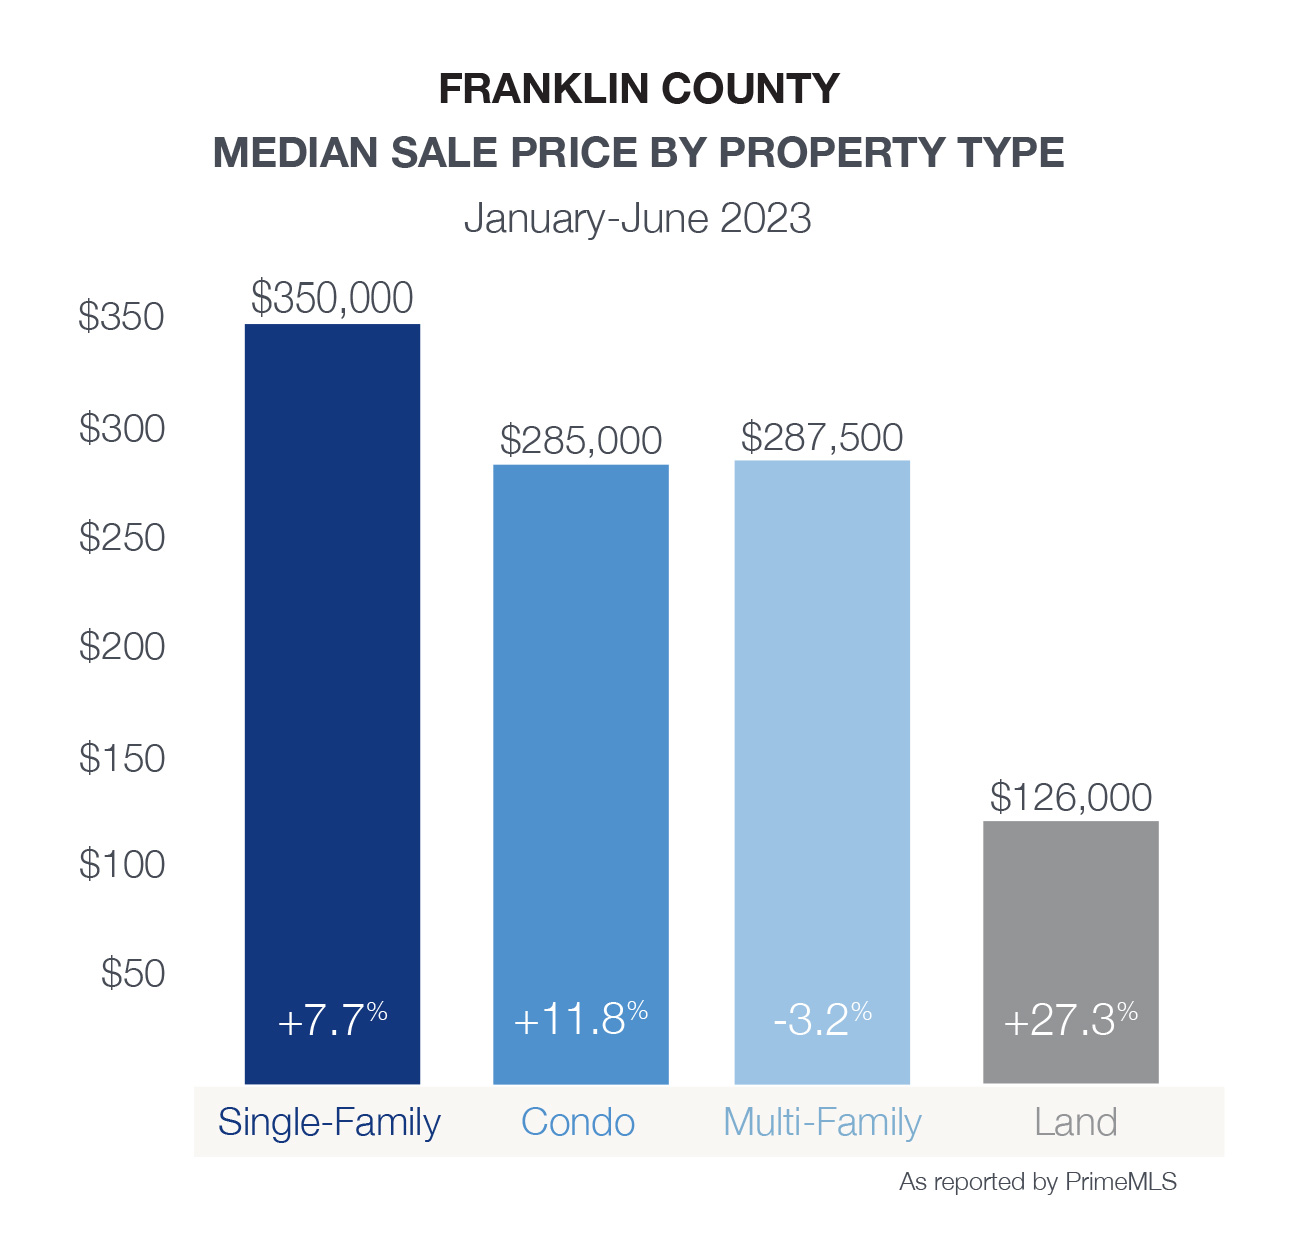
| $350,000 +7.7% | $358,532 +4.0% | 182 -26.9% | 275 -17.2% | 45 +45.0% |
| Single-Family January-June 2023 | ||||
|---|---|---|---|---|
| Median Sale Price: | Average Sale Price: | Units Sold: | Newly Listed: | Days on Market: |
| $285,000 +11.8% | $301,786 -6.3% | 14 -39.1% | 31 +29.2% | 8 -81.4% |
The first half of 2023 saw a decline of 27% in closed sales for single-family homes in Franklin County, compared to the same period last year. Additionally, new listings for single-family homes in the county dropped by 17% year-over-year, contributing to the limited inventory and increased competition among buyers.
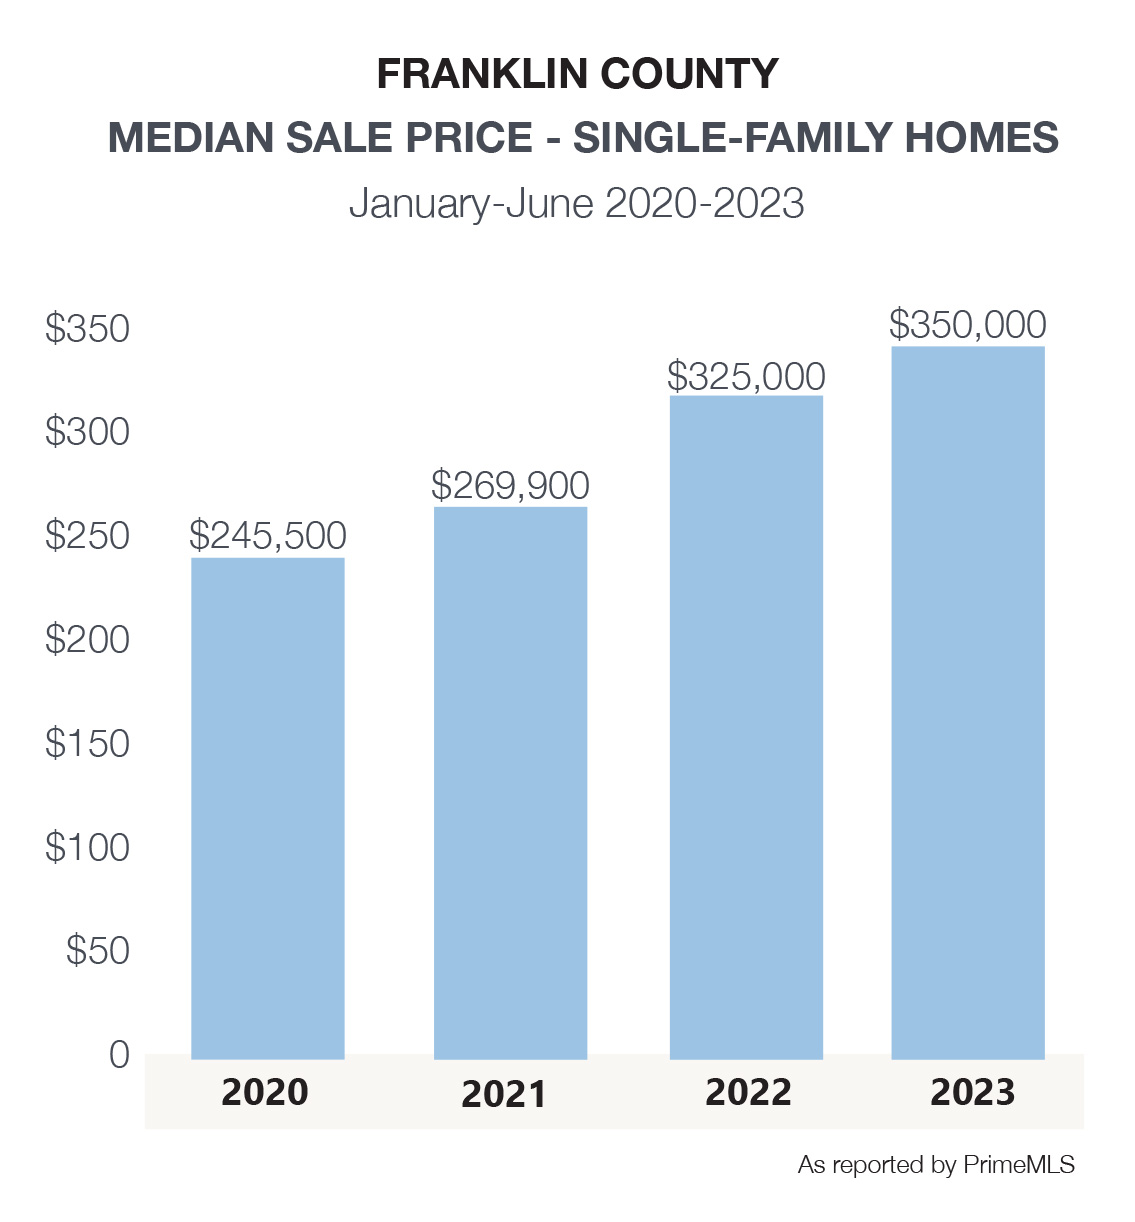
Despite the challenges faced by the single-family home market in Franklin County, the median sale price for homes increased by around 8% compared to 2022, demonstrating that demand remains strong in this segment of the market. Among the counties included in this report, the median price of $350,000 positions Franklin as the most affordable. Not only is it easily accessible to I-89, but Franklin County also a variety of property types such as single family, condos, multi-family, and land for buyers to consider.
Fairfax, Georgia, Swanton post some of the highest number of sales in the county – along with an increase in the median sale price, indicating that these areas remain attractive to buyers.


| MEDIAN SALE PRICE | VS 2022 | UNITS SOLD | VS 2022 | NEWLY LISTED | VS 2022 | DAYS ON MARKET | |
|---|---|---|---|---|---|---|---|
| Franklin County Single-Family | $350,000 | 7.7% | 182 | -26.9% | 275 | -17.2% | 45 |
| Bakersfield | $397,000 | 41.3% | 4 | -55.6% | 5 | -16.7% | 22 |
| Berkshire | $232,250 | -28.5% | 4 | -60.0% | 4 | -60.0% | 107 |
| Enosburg | $260,000 | 10.6% | 7 | -46.2% | 14 | -33.3% | 98 |
| Fairfax | $478,750 | 19.7% | 32 | 28.0% | 33 | -5.7% | 21 |
| Fairfield | $250,000 | -41.2% | 5 | 66.7% | 8 | 100.0% | 30 |
| Fletcher | $625,000 | 30.9% | 1 | -50.0% | 6 | 50.0% | 6 |
| Franklin | $352,000 | 40.5% | 7 | -12.5% | 9 | -50.0% | 133 |
| Georgia | $444,750 | 9.8% | 14 | -26.3% | 21 | -12.5% | 20 |
| Highgate | $370,000 | 16.1% | 9 | -50.0% | 21 | -19.2% | 142 |
| Montgomery | $404,000 | 6.3% | 2 | -84.6% | 8 | -46.7% | 87 |
| Richford | $190,000 | -16.5% | 14 | 75.0% | 21 | 16.7% | 58 |
| Sheldon | $320,000 | 60.0% | 6 | 20.0% | 11 | 22.2% | 11 |
| St. Albans | $340,000 | -9.3% | 49 | -31.0% | 73 | -15.1% | 22 |
| Swanton | $305,000 | 6.6% | 28 | -37.8% | 41 | -26.8% | 54 |
