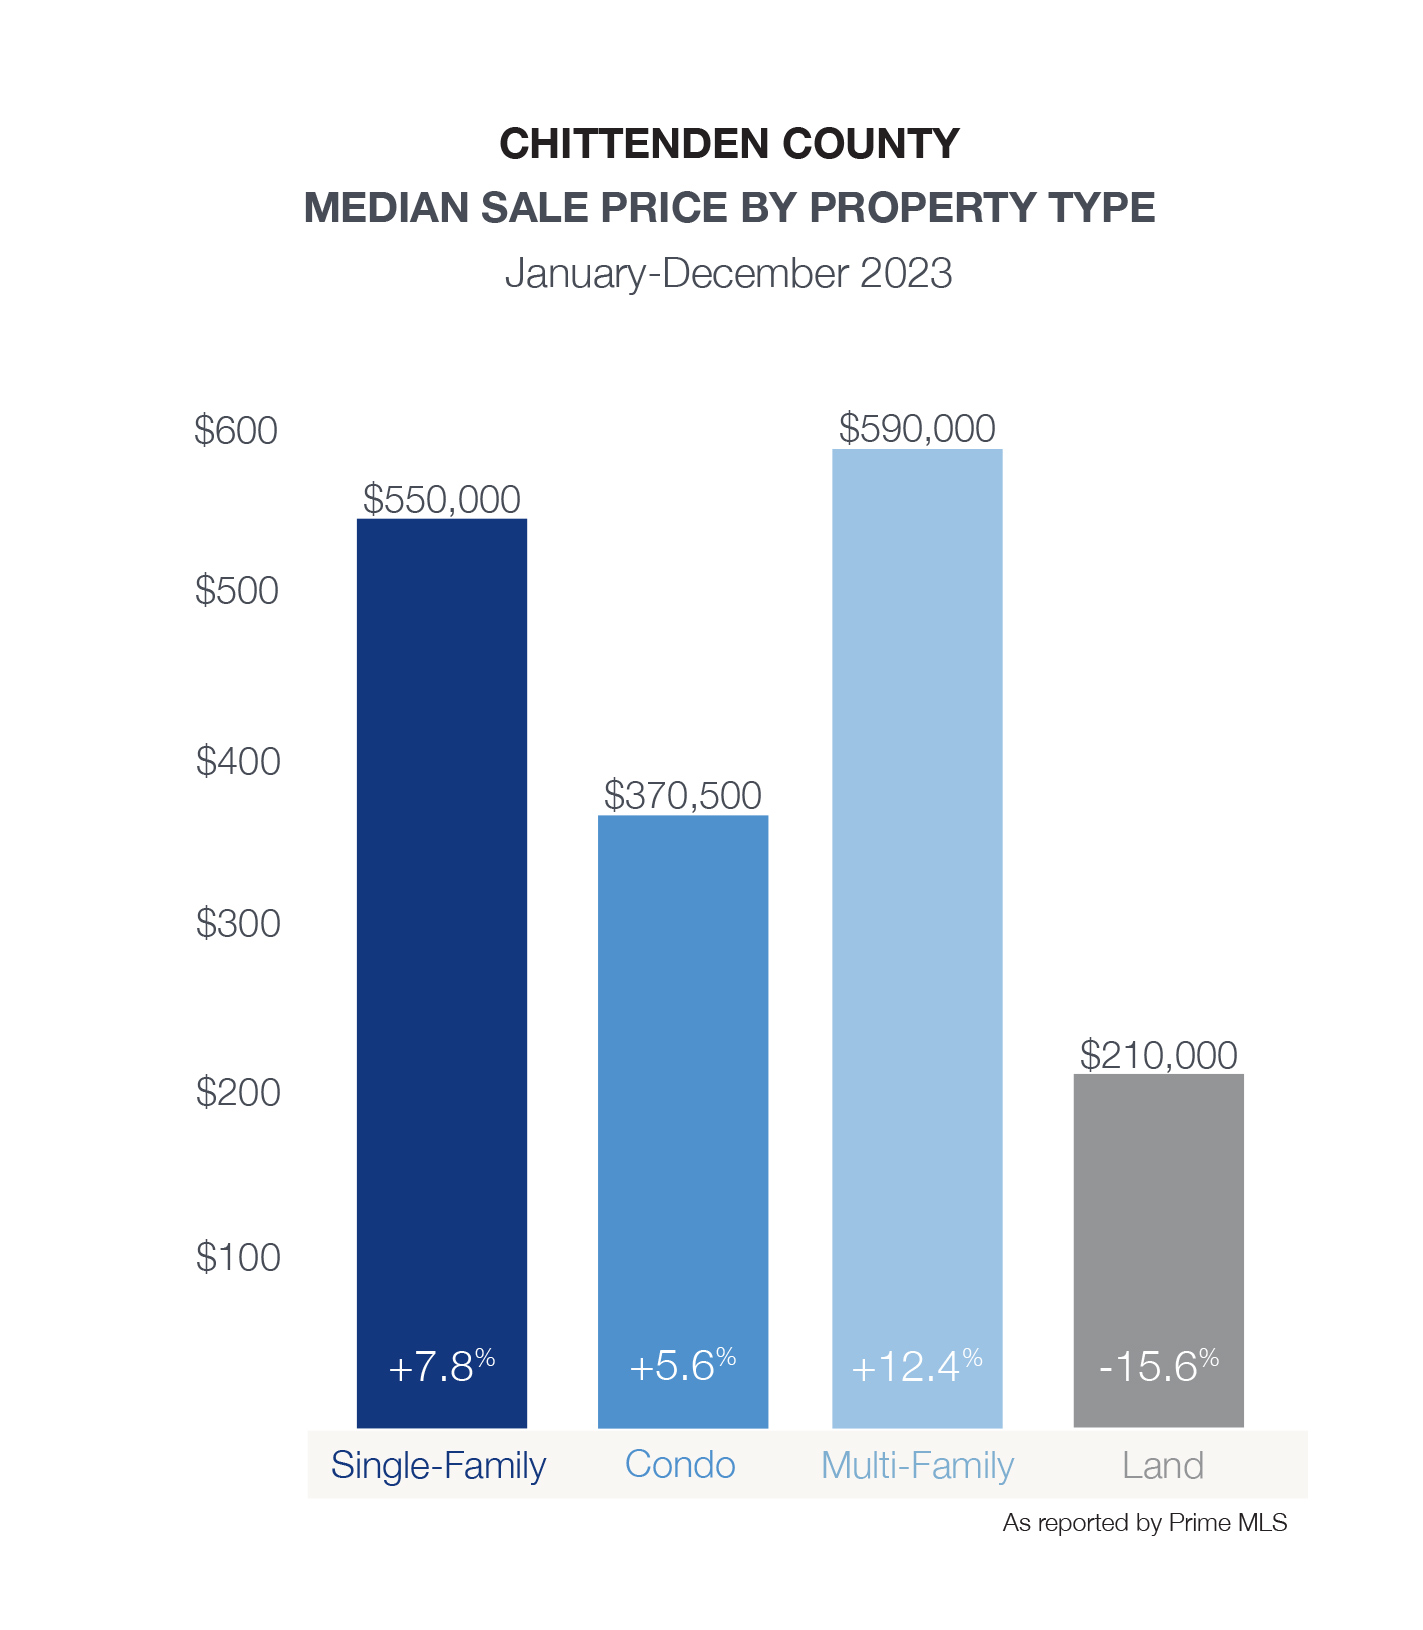
| Single-Family January-December 2023 | ||||
|---|---|---|---|---|
| Median Sale Price: | Average Sale Price: | Units Sold: | Newly Listed: | Days on Market: |
| $550,000 +7.8% | $610,596 +3.1% | 967 -14.6% | 1,110 -11.4% | 25 +31.6% |
| Condos January-December 2023 | ||||
|---|---|---|---|---|
| Median Sale Price: | Average Sale Price: | Units Sold: | Newly Listed: | Days on Market: |
| $370,500 +5.6% | $414,177 +6.0% | 501 -22.1% | 570 -11.4% | 22 +10.0% |
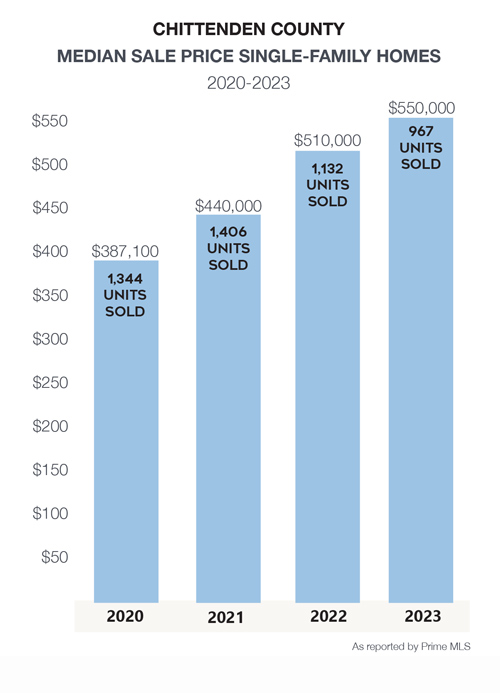
 While prices for single-family homes have increased across the county by 42% since 2020, growth has moderated in 2023 at a 7% increase. Homeowners have seen increased equity over the past few years, while benefiting as the largest portion of their living expenses – their mortgage – remained stable. Although buyer demand remained strong, a drop of 11% in new listings resulted in a decline of closed sales.
Some buyers, many who paused searches due to rising interest rates, will reenter the market this spring to face competitive offers. This is more frequent in the more affordable price ranges. The decline in new listings is predicted to moderate as lifestyle factors encourage many sellers to maximize gains and make long delayed moves.
Several new construction projects in the county neared completion in 2023 which affected the new inventory coming to market as well as the number of closed sales. In the spring, Hillside East in South Burlington introduced one of the nation’s first 100% fossil fuel and carbon-free, climate resilient neighborhoods. With construction well underway, and more than a dozen homes scheduled for completion and closing by this summer, a variety of single-family homes and townhomes are available for reservation in the already established community.
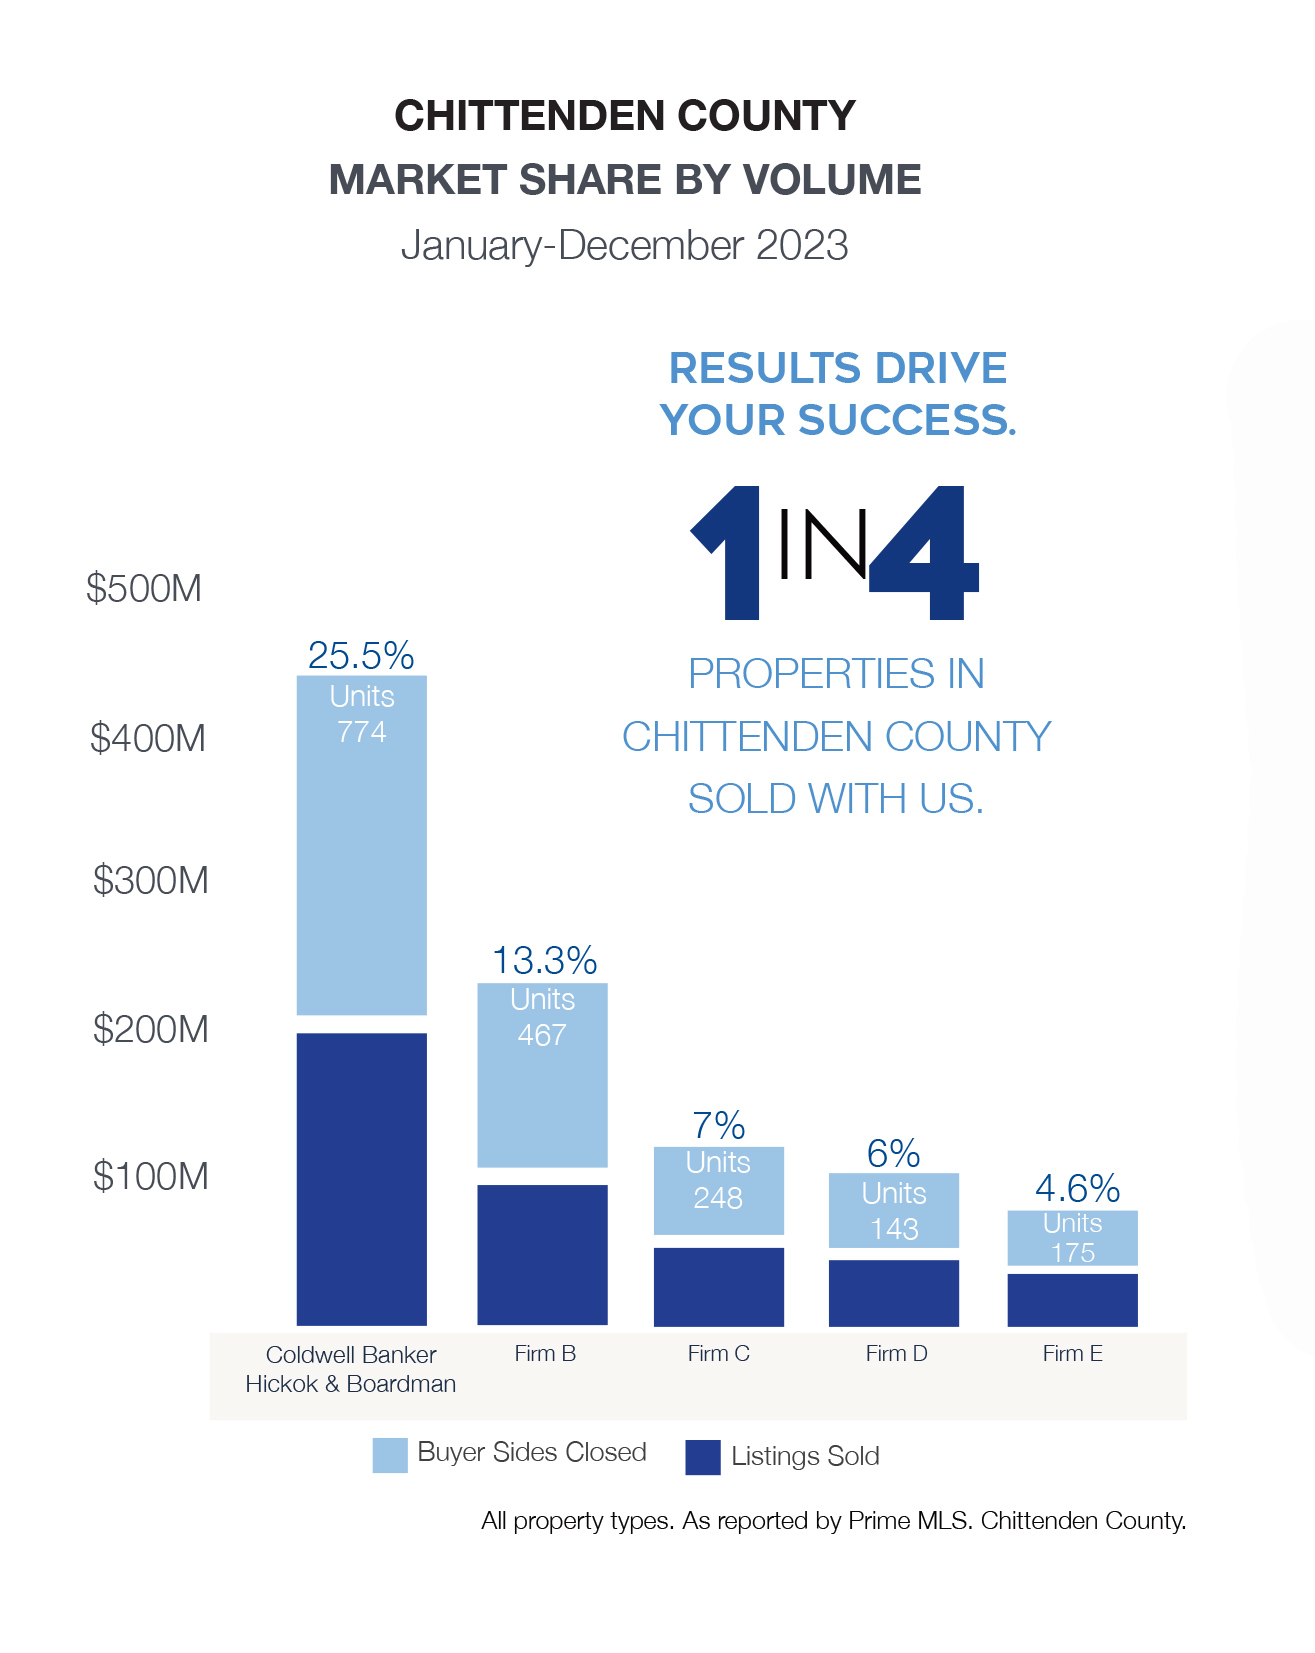
In Chittenden County, Coldwell Banker Hickok & Boardman Agents represented clients in more than 1 in 4 sales. Buying or selling your home is a big deal – the experience and results your Agent and real estate brokerage offer should be, too.
| MEDIAN SALE PRICE | VS 2022 | UNITS SOLD | VS 2022 | NEWLY LISTED | VS 2022 | DAYS ON MARKET | |
|---|---|---|---|---|---|---|---|
| Chittenden County Single-Family | $550,000 | 7.80% | 967 | -14.60% | 1110 | 11.10% | 25 |
| Bolton | $521,000 | -14.00% | 8 | 100.00% | 9 | 0.10% | 18 |
| Burlington | $565,000 | 8.70% | 142 | -25.70% | 158 | 1.60% | 27 |
| Charlotte | $852,500 | 21.80% | 28 | -31.70% | 37 | 0.40% | 34 |
| Colchester | $497,500 | 2.70% | 108 | -1.80% | 143 | 1.40% | 25 |
| Essex | $485,000 | 7.80% | 134 | -26.00% | 139 | 1.40% | 28 |
| Hinesburg | $578,500 | 19.30% | 30 | -30.20% | 36 | 0.40% | 14 |
| Huntington | $446,000 | 33.20% | 6 | -72.70% | 7 | 0.10% | 12 |
| Jericho | $548,000 | 11.80% | 40 | 14.30% | 54 | 0.50% | 15 |
| Milton | $454,750 | 9.10% | 94 | 19.00% | 100 | 1.00% | 36 |
| Richmond | $705,000 | 41.40% | 25 | 4.20% | 28 | 0.30% | 17 |
| Shelburne | $725,000 | -5.20% | 57 | -32.90% | 65 | 0.70% | 29 |
| South Burlington | $632,450 | 4.50% | 145 | 4.30% | 167 | 1.70% | 19 |
| St. George | $681,000 | 69.50% | 7 | 75.00% | 5 | 0.10% | 53 |
| Underhill | $620,000 | 15.20% | 29 | 20.80% | 33 | 0.30% | 17 |
| Westford | $584,000 | 38.10% | 14 | -12.50% | 19 | 0.20% | 10 |
| Williston | $608,000 | 0.90% | 73 | -27.00% | 82 | 0.80% | 32 |
| Winooski | $375,000 | 3.30% | 27 | -20.60% | 28 | 0.30% | 16 |
| MEDIAN SALE PRICE | VS 2022 | UNITS SOLD | VS 2022 | NEWLY LISTED | VS 2022 | DAYS ON MARKET | |
|---|---|---|---|---|---|---|---|
| Chittenden County Condo | $370,500 | 5.60% | 501 | -22.10% | 570 | -11.40% | 22 |
| Bolton | $283,000 | 9.40% | 5 | -50.00% | 6 | -45.50% | 4 |
| Burlington | $369,250 | -7.70% | 90 | -32.30% | 97 | -32.20% | 21 |
| Charlotte | $620,000 | 67.60% | 1 | 0.00% | 2 | 100.00% | 0 |
| Colchester | $373,500 | 13.20% | 54 | -22.90% | 55 | -14.10% | 22 |
| Essex | $365,000 | 7.40% | 85 | -20.60% | 101 | 1.00% | 11 |
| Hinesburg | $290,000 | -27.70% | 3 | -70.00% | 4 | -63.60% | 4 |
| Jericho | $375,000 | 28.60% | 5 | 150.00% | 8 | 700.00% | 6 |
| Milton | $345,000 | 26.40% | 23 | 53.30% | 35 | 45.80% | 126 |
| Richmond | $355,000 | 4.40% | 1 | -50.00% | 1 | -50.00% | 7 |
| Shelburne | $599,466 | 39.40% | 28 | 21.70% | 28 | 33.30% | 50 |
| South Burlington | $340,000 | 3.00% | 130 | -33.70% | 148 | -22.10% | 13 |
| Williston | $435,000 | 4.80% | 55 | -6.80% | 60 | 0.00% | 16 |
| Winooski | $365,000 | 1.10% | 21 | 40.00% | 25 | 66.70% | 12 |
