| Median Sale Price | Average Sale Price | Units Sold | Newly Listed | Days on Market | |
|---|---|---|---|---|---|
| Single-Family | $333,950 (5.9%) | $390,601 (12%) | 196 (1.6%) | 323 (5.9%) | 62 (-23.5%) |
| Condos | $235,750 (8.6%) | $263,245 (4.4%) | 104 (0%) | 137 (-15.4%) | 78 (18.2%) |
| Multi-Family | $456,000 (13.4%) | $452,664 (-23.6%) | 16 (-36%) | 40 (110.5%) | 38 (-60%) |
| Land | $120,000 (-5.9%) | $150,538 (-54.4%) | 13 (-7.1%) | 33 (-15.4%) | 208 (-27.5%) |
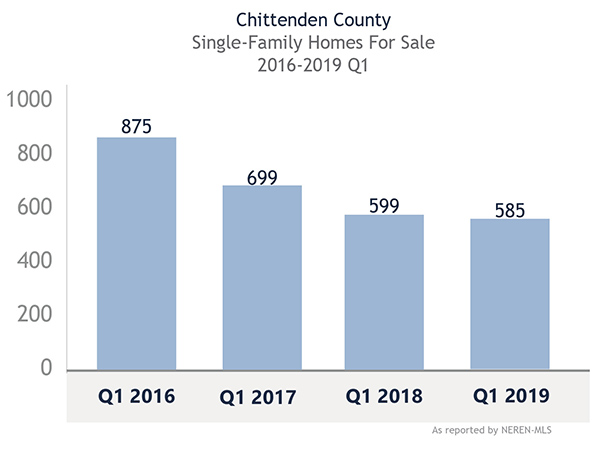
Newly listed single-family homes showed a slight uptick over the same period last year while condo listings declined. .
 New developments throughout the county, which include condominiums, may be affecting the flow of inventory year over year. Residential sales were relatively flat while median and average sale prices rose during the 1st quarter. Buyer demand is still strong for well positioned properties coming to market – as demonstrated by the average days on market (DOM) of just over 2 months.
