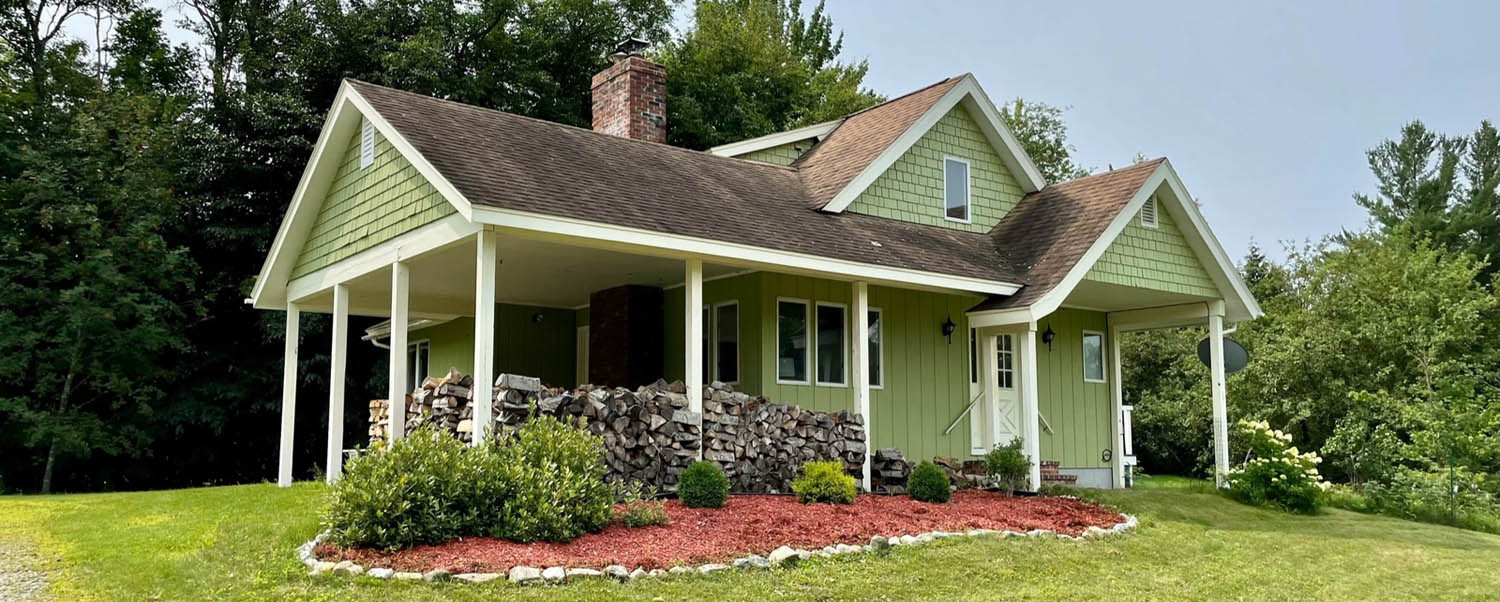
Well maintained & updated 3 bedroom, 2.5 bath sunlit Cape, located near the end of a sleepy cul-de-sac just minutes away from all that Jeffersonville has to offer. Cambridge
| Single-Family Q1 2023 | |||
|---|---|---|---|
| New Listings | Units Sold | Median Sold Price | Days on Market |
| 53 (-21%) | 42 (-31%) | $498K (+14%) | 24 (+60%) |
| Condos Q1 2023 | |||
|---|---|---|---|
| New Listings | Units Sold | Median Sold Price | Days on Market |
| 37 (+23%) | 28 (+27%) | $463K (+26%) | 27 (-6.90%) |
Lamoille County‘s single-family home market saw a decline in both sales volume and new listings in the first quarter of 2023, with a drop of approximately 31% and 21%, respectively, compared to the same period last year.
Despite the lower sales volume and limited inventory, the median sold price for single-family homes in the county increased by approximately 14.7% year-over-year, indicating continued strong demand in this segment of the market.
The condo market in Lamoille County fared better, with a median price increase of around 26% compared to the first quarter of 2022, and an increase in both sales volume (27.7%) and new listings (23%) for condos. This suggests that the condo market may be a more attractive option for buyers in this area, given the limited inventory for single-family homes.
| NEW LISTINGS | VS Q1 2021 | PROPERTIES SOLD | VS Q1 2021 | MEDIAN SOLD PRICE | VS Q1 2021 | MEDIA DOM | |
|---|---|---|---|---|---|---|---|
| Belvidere | 2 | 100% | 1 | -50% | $360 K | 6.67% | 3 |
| Single Family | 2 | 100% | 1 | -50% | $360 K | 6.67% | 3 |
| Condo | 0 | 0 | $0 | 0 | |||
| Cambridge | 11 | -15% | 12 | -7.69% | $300 K | 30% | 27 |
| Single Family | 6 | 0.00% | 10 | 43% | $304 K | -7.88% | 27 |
| Condo | 5 | -29% | 2 | -67% | $300 K | 74% | 196 |
| Eden | 3 | 200% | 2 | -50% | $233 K | -21% | 7 |
| Single Family | 3 | 200% | 2 | -50% | $233 K | -21% | 7 |
| Condo | 0 | 0 | $0 | 0 | |||
| Elmore | 1 | 1 | -75% | $500 K | 4.17% | 58 | |
| Single Family | 1 | 1 | -75% | $500 K | 4.17% | 58 | |
| Condo | 0 | 0 | $0 | 0 | |||
| Hyde Park | 5 | -55% | 3 | -40% | $300 K | -9.37% | 7 |
| Single Family | 5 | -55% | 3 | -40% | $300 K | -9.37% | 7 |
| Condo | 0 | 0 | $0 | 0 | |||
| Johnson | 2 | -71% | 3 | -40% | $389 K | 3.18% | 23 |
| Single Family | 2 | -71% | 3 | -40% | $389 K | 3.18% | 23 |
| Condo | 0 | 0 | $0 | 0 | |||
| Morristown | 19 | -14% | 10 | -38% | $350 K | -11% | 8 |
| Single Family | 17 | -19% | 8 | -50% | $420 K | 6.34% | 8 |
| Condo | 2 | 100% | 2 | $273 K | 16 | ||
| Stowe | 43 | 13% | 37 | 19% | $968 K | -0.72% | 35 |
| Single Family | 13 | -19% | 13 | -13% | $1.20 M | -29% | 42 |
| Condo | 30 | 36% | 24 | 50% | $705 K | 34% | 30 |
| Wolcott | 3 | 50% | 1 | -67% | $495 K | 32% | 42 |
| Single Family | 3 | 50% | 1 | -67% | $495 K | 32% | 42 |
| Condo | 0 | 0 | $0 | 0 | |||
| Total | 90 | -7.22% | 70 | -16% | $484 K | 16% | 25 |
| Single Family | 53 | -21% | 42 | -31% | $498 K | 14% | 24 |
| Condo | 37 | 23% | 28 | 27% | $463 K | 26% | 27 |
