| Single-Family January-December 2023 | ||||
|---|---|---|---|---|
| Median Sale Price: | Average Sale Price: | Units Sold: | Newly Listed: | Days on Market: |
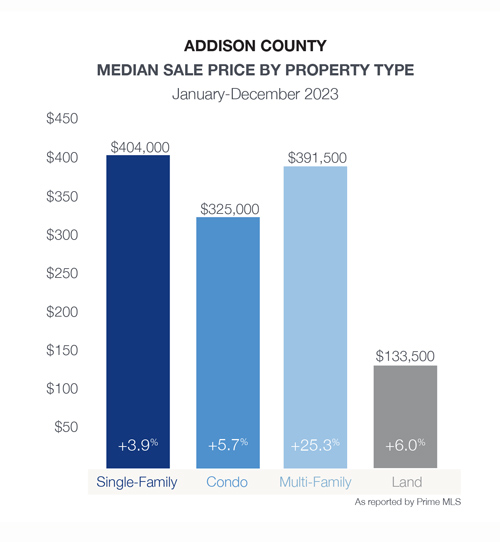
| $404,000 +3.9% | $490,373 +6.8% | 278 -8.9% | 319 -7.5% | 30 -6.3% |
| Condos January-December 2023 | ||||
|---|---|---|---|---|
| Median Sale Price: | Average Sale Price: | Units Sold: | Newly Listed: | Days on Market: |
| $325,000 +5.7% | $361,542 +2.0% | 18 0.0% | 20 +53.9% | 22 -8.3% |
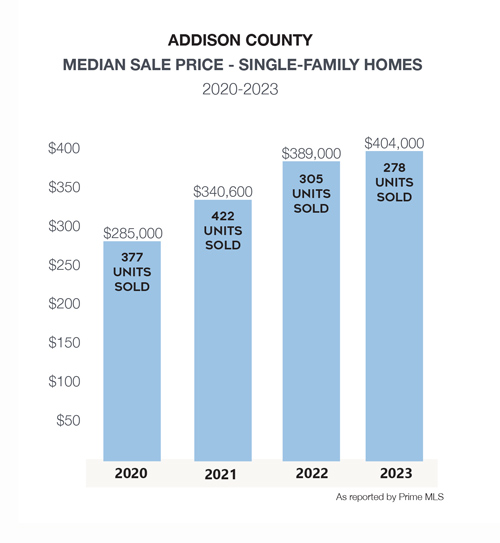
The real estate market in Addison County is not immune to the trends seen across other counties in this report although at a more moderate pace. The number of single-family homes sales declined by 27 units, while the number of new listings on the market dropped by 26 units.
The median sale price increased by nearly 4% in 2023, with a cumulative increase of 42% since 2020. Panton, Leicester, Weybridge, and Cornwall posted significantly higher median sale prices than the county median of $404,000.
Middlebury, Bristol, Ferrisburgh, Monkton, Orwell, and Vergennes proved the most popular with the greatest number of sales, however far fewer new listings as compared to last year.
With a small number of transactions in many towns, the data can show dramatic swings in one direction or the other.


| MEDIAN SALE PRICE | VS 2022 | UNITS SOLD | VS 2022 | NEWLY LISTED | VS 2022 | DAYS ON MARKET | |
|---|---|---|---|---|---|---|---|
| Addison County Single-Family | $404,000 | 3.90% | 278 | -8.90% | 319 | -7.50% | 30 |
| Addison | $514,500 | 3.40% | 10 | -37.50% | 12 | -36.80% | 70 |
| Bridport | $300,000 | 3.50% | 11 | 57.10% | 16 | 77.80% | 13 |
| Bristol | $394,000 | 1.30% | 28 | -9.70% | 32 | -3.00% | 21 |
| Cornwall | $565,000 | -10.30% | 14 | 27.30% | 14 | 0.00% | 35 |
| Ferrisburgh | $490,000 | -14.90% | 26 | -7.10% | 30 | -3.20% | 22 |
| Goshen | $192,035 | -48.10% | 3 | -25.00% | 6 | 200.00% | 64 |
| Granville | $144,000 | -56.10% | 4 | -33.30% | 4 | -20.00% | 46 |
| Hancock | $290,000 | 28.90% | 5 | 66.70% | 6 | 100.00% | 40 |
| Leicester | $526,500 | 75.50% | 12 | -20.00% | 11 | -38.90% | 52 |
| Lincoln | $495,000 | 28.00% | 6 | -66.70% | 9 | -55.00% | 22 |
| Middlebury | $400,000 | 8.80% | 39 | -15.20% | 41 | -22.60% | 24 |
| Monkton | $424,900 | -6.60% | 17 | -22.70% | 21 | -8.70% | 8 |
| New Haven | $493,750 | 8.50% | 12 | -14.30% | 14 | -17.70% | 33 |
| Orwell | $294,500 | -25.40% | 18 | 38.50% | 19 | 26.70% | 40 |
| Panton | $1,906,500 | 515.00% | 5 | -44.40% | 6 | -33.30% | 3 |
| Ripton | $306,000 | -36.30% | 5 | 400.00% | 4 | 300.00% | 116 |
| Salisbury | $510,000 | 22.90% | 9 | -18.20% | 16 | 60.00% | 35 |
| Shoreham | $390,000 | -9.10% | 11 | 120.00% | 13 | 44.40% | 25 |
| Starksboro | $395,000 | 46.30% | 13 | 62.50% | 13 | 44.40% | 22 |
| Vergennes | $345,000 | 7.50% | 18 | -25.00% | 19 | -29.60% | 27 |
| Waltham | $499,500 | -21.20% | 4 | 300.00% | 4 | 100.00% | 9 |
| Weybridge | $533,500 | 18.00% | 6 | -25.00% | 7 | -46.20% | 41 |
| Whiting | $335,975 | 3.50% | 2 | -50.00% | 2 | -33.30% | 5 |
