A surge in newly listed condos and single-family homes resulted in 658 closed sales during the first 6 months of the year. This is the first time in over 5 years that the number of closed sales has not declined. Burlington, Essex, Williston, Hinesburg, and Jericho all posted increases in sales.
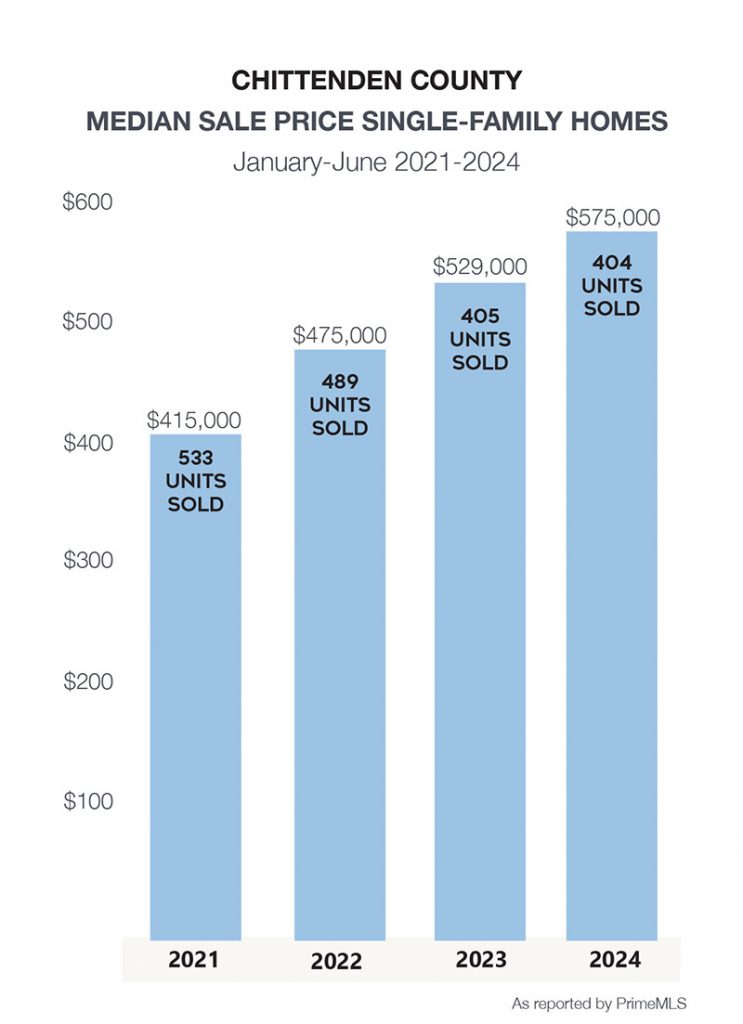
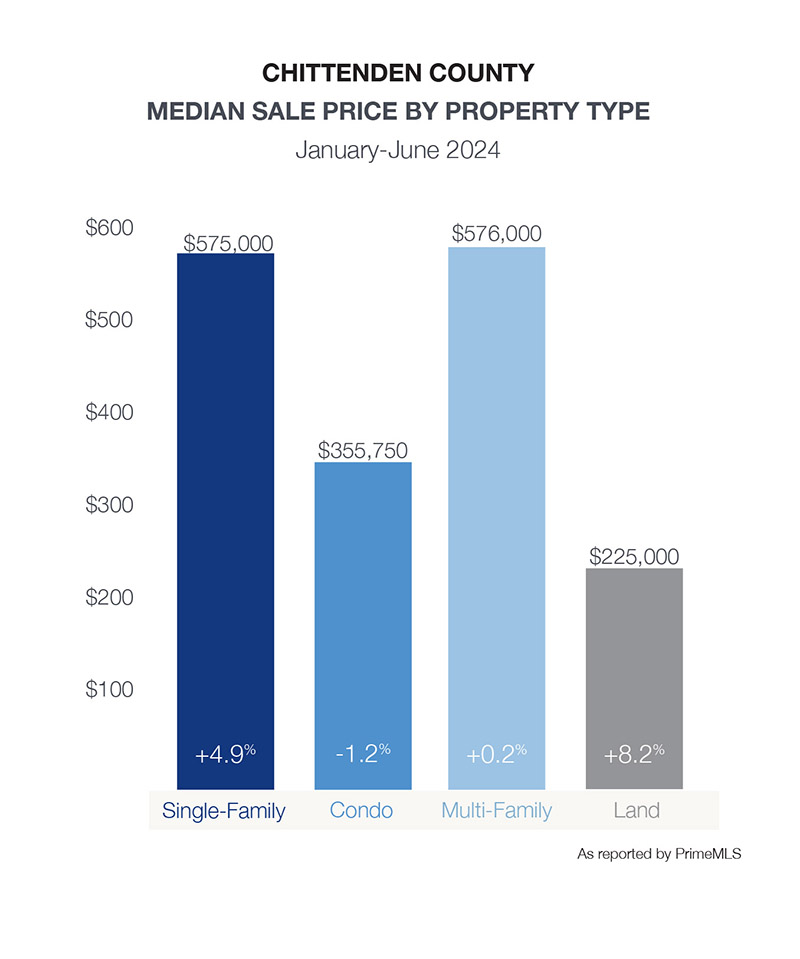
| Single-Family January-June 2024 | ||||
|---|---|---|---|---|
| Median Sale Price: | Average Sale Price: | Units Sold: | Newly Listed: | Days on Market: |
| $575,000 +4.9% | $680,847 +13.5% | 404 -0.3% | 605 +9.2% | 31 +10.7% |
| Condos January-June 2024 | ||||
|---|---|---|---|---|
| Median Sale Price: | Average Sale Price: | Units Sold: | Newly Listed: | Days on Market: |
| $355,750 -1.2% | $413,025 -1.3% | 254 +8.6% | 390 +30.4% | 23 +35.3% |
 South Burlington’s drop-in single-family sales reflects a shift in new construction sales during the first half of 2023 vs 2024. As O’Brien’s Hillside East closes many new homes through the remainder of 2024, the results in South Burlington will shift.
Condos were a bright spot in Chittenden County sales, increasing nearly 9% with a 30% jump in available condos. South Burlington, Essex, Colchester, and Burlington lead the market.
| SINGLE FAMILY SALE PRICE | MEDIAN | VS 2023 | UNITS SOLD | VS 2023 | NEWLY LISTED | VS 2023 | DAYS ON MARKET |
|---|---|---|---|---|---|---|---|
| Bolton | $547,600 | -5.3% | 3 | -25.0% | 3 | -40.0% | 5 |
| Burlington | $530,750 | -13.0% | 72 | 4.4% | 112 | 47.4% | 28 |
| Charlotte | $675,000 | 22.7% | 13 | 85.7% | 21 | 61.5% | 18 |
| Colchester | $560,000 | 9.2% | 34 | -19.1% | 59 | -22.4% | 35 |
| Essex | $575,000 | 18.9% | 63 | 1.6% | 85 | 16.4% | 38 |
| Hinesburg | $726,000 | 26.8% | 18 | 350.0% | 27 | 68.8% | 57 |
| Huntington | $282,500 | 13.0% | 2 | 0.0% | 5 | 66.7% | 12 |
| Jericho | $564,750 | -4.3% | 18 | 63.6% | 27 | 12.5% | 58 |
| Milton | $500,000 | 17.7% | 39 | -4.9% | 44 | -8.3% | 22 |
| Richmond | $525,000 | 10.0% | 10 | 25.0% | 24 | 84.6% | 6 |
| Shelburne | $690,000 | -22.0% | 17 | -19.1% | 29 | -14.7% | 46 |
| South Burlington | $583,500 | -6.8% | 54 | -25.0% | 89 | -6.3% | 24 |
| St. George | $885,000 | 31.1% | 1 | -75.0% | 2 | -60.0% | 5 |
| Underhill | $775,000 | 43.5% | 12 | 33.3% | 18 | 12.5% | 65 |
| Westford | $375,000 | -33.7% | 7 | 0.0% | 11 | 57.1% | 25 |
| Williston | $742,250 | 21.5% | 34 | 9.7% | 35 | 2.9% | 22 |
| Winooski | $410,000 | 13.9% | 7 | -36.40% | 14 | -12.5% | 7 |
| CONDO SALE PRICE | MEDIAN | VS 2023 | UNITS SOLD | VS 2023 | NEWLY LISTED | VS 2023 | DAYS ON MARKET |
|---|---|---|---|---|---|---|---|
| Bolton | $315,000 | 11.3% | 4 | 33.3% | 4 | 33.3% | 17 |
| Burlington | $320,000 | -15.0% | 45 | 2.3% | 87 | 70.6% | 19 |
| Charlotte | $350,000 | 0.0% | 1 | 0.0% | 2 | 100.0% | 6 |
| Colchester | $361,750 | -8.4% | 24 | 20.0% | 37 | 19.4% | 18 |
| Essex | $353,250 | -2.5% | 39 | 8.3% | 55 | 1.9% | 29 |
| Hinesburg | $545,000 | 89.2% | 1 | 0.0% | 3 | 50.0% | 4 |
| Jericho | $345,000 | -9.5% | 3 | -25.0% | 2 | -60.0% | 5 |
| Milton | $488,952 | 103.7% | 14 | 180.0% | 17 | 21.4% | 65 |
| Richmond | n/a | 0.0% | n/a | 0.0% | 1 | 0.0% | n/a |
| Shelburne | $510,000 | -14.6% | 13 | -13.3% | 29 | 81.3% | 21 |
| South Burlington | $339,000 | 1.2% | 78 | 16.4% | 107 | 39.0% | 21 |
| Williston | $460,000 | 8.9% | 25 | -10.7% | 36 | 16.1% | 13 |
| Winooski | $339,000 | -3.7% | 7 | -36.4% | 10 | -28.6% | 12 |
